
Hi,
We have a WebClient application that we have been running on classic AppServer for a couple of years now. Our client base is in South Africa and other African regions - I am adding this because the network/internet infrastructure is not as advanced as seen in other countries. We still have clients that connect over ADSL and at times these connections drop quite often. With the classic appserver this was handled quite sufficiently most of the time - it would time out and then retry to connect to the appserver from the client and all would be well.
We have recently started to move some of our clients onto PAS (OE11.7.5), but this seems to prove quite painful as we have constant application crashes and this looks like it only happens when there is a drop in the network, especially when the server-side is attempting to send data back to the client. The following is seen in the PAS server log file:
[19/11/18@15:16:26.413+0200] P-077299 T-1109899008 1 AS-4 -- (Procedure: 'Consultingwerk.OERA.Query.QueryString' Line:0) SYSTEM ERROR: Memory violation. (49)
[19/11/18@15:16:26.413+0200] P-077299 T-1109899008 1 AS-4 MSAS Thread (10) crash in Session AS-4. Potential leak 220MB.
[19/11/18@15:16:26.413+0200] P-077299 T-1109899008 1 AS-4 -- (Procedure: 'Consultingwerk.OERA.Query.QueryString' Line:0) ** Save file named core for analysis by Progress Software Corporation. (439)
[19/11/14@19:39:58.541+0200] P-106237 T-4139706112 1 AS-17 -- (Procedure: 'OERA/support/proSIretrieve.p' Line:0) SYSTEM ERROR: Memory violation. (49)
[19/11/14@19:39:58.541+0200] P-106237 T-4139706112 1 AS-17 MSAS Thread (17) crash in Session AS-17. Potential leak 237MB.
[19/11/14@19:39:58.541+0200] P-106237 T-4139706112 1 AS-17 -- (Procedure: 'OERA/support/proSIretrieve.p' Line:0) Connection failure for host ServerIP port 38398 transport TCP. (9407)
[19/11/14@19:39:58.541+0200] P-106237 T-4139706112 1 AS-17 -- (Procedure: 'OERA/support/proSIretrieve.p' Line:0) ** Save file named core for analysis by Progress Software Corporation. (439)
Note that the Host 'ServerIP' is the IP address where PAS is hosted.
We then did a test, we had some of the clients connect to the classic appserver on the same server from the same client network and they are not experiencing this issue when the network drops.
So, my question is - Is there any other way that we can overcome this issue in PAS for intermittent network failures? Why does PAS seem so sensitive to network drops as apposed to the classic appserver?
Do you have a protrace or core file? There was just a bug fixed in 11.7.5 hot fix which may or may not be related.
Thanks, Roy
Hi Roy,
I tried to attach the file, didn't work, pasting the contents here instead:
PROGRESS stack trace as of Mon Nov 18 15:16:26 2019
Progress OpenEdge Release 11.7 build 1811 SP05 on Linux taurus 3.10.0-957.21.3.el7.x86_64 #1 SMP Tue Jun 18 16:35:19 UTC 2019
Command line arguments are
/u/progress/openedge/117/bin/_mproapsv -logginglevel 2 -logfile /u9/logs/halfway_toyota.agent.log -uburl AppServerDC://0.0.0.0:41445/ -logname halfway_toyota -logentrytypes ASPlumbing,DB.Connects -ubpropfile /u/pas/t_group1/conf/openedge.properties -ASID 2 -ipver IPv4 -sectok XXXXXXXXXXXXXXXXXXXXXX -pf /u8/rslive/rsclient/halfway_toyota/appserver.pf
Startup parameters:
-pf /u/progress/openedge/117/startup.pf,-cpinternal ISO8859-1,-cpstream ISO8859-1,-cpcoll Basic,-cpcase Basic,-d dmy,-numsep 44,-numdec 46,(end .pf),-logginglevel 2,-logfile /u9/logs/halfway_toyota.agent.log,-uburl AppServerDC://0.0.0.0:41445/,-logname halfway_toyota,-logentrytypes ASPlumbing,DB.Connects,-ubpropfile /u/pas/t_group1/conf/openedge.properties,-ASID 2,-ipver IPv4,-sectok XXXXXXXXXXXXXXXXXXXXXX,-pf /u8/rslive/rsclient/halfway_toyota/appserver.pf,-pf /u8/rslive/rsclient/globalappserver.pf,-rereadnolock,-noincrwarn,-mmax 65534,-D 500,-s 128,-h 12,-l 1000,-lkwtmo 120,-yr4def,-q,-T /u9/rstmp,-NL,-tmpbsize 8,-Bt 2500,(end .pf),-db /u8/rslive/database/dwp,-db intdb,-H cronus,-S 10003,-N tcp,-db /u8/EVOLVE/halfway_toyota/commondb,-db /u8/EVOLVE/halfway_toyota/documentdb,-db /u8/EVOLVE/halfway_toyota/dwplocal,-db /u8/EVOLVE/halfway_toyota/retaildb,-db /u8/EVOLVE/halfway_toyota/smartdb,-db /u8/EVOLVE/halfway_toyota/temp-db,-db globaldb,-H cronus,-S 9000,-N tcp,(end .pf)
#1 [0xb35787] uttraceback+0x57 from /u/progress/openedge/117/bin/_mproapsv
#2 [0xb39230] uttrace_withsigid+0x1f0 from /u/progress/openedge/117/bin/_mproapsv
#3 [0xb394c7] utcoreEx+0xc7 from /u/progress/openedge/117/bin/_mproapsv
#4 [0x49b7be] drexit+0x5de from /u/progress/openedge/117/bin/_mproapsv
#5 [0x9d0535] drSigFatal+0xbd from /u/progress/openedge/117/bin/_mproapsv
#6 [0xea1de5d0] __restore_rt+0x0 from /lib64/libpthread.so.0
#7 [0x5d954c] doMoreSchemaCheck+0x2cc from /u/progress/openedge/117/bin/_mproapsv
#8 [0x5d9e58] csoGetSchRequest+0x388 from /u/progress/openedge/117/bin/_mproapsv
#9 [0x42d0bc] getSchemaItem+0x1c from /u/progress/openedge/117/bin/_mproapsv
#10 [0x430d1e] ReaderInputRequest+0x19e from /u/progress/openedge/117/bin/_mproapsv
#11 [0x432674] open4GLWrite+0xe4 from /u/progress/openedge/117/bin/_mproapsv
#12 [0x432784] open4GLWriteLast+0x84 from /u/progress/openedge/117/bin/_mproapsv
#13 [0x4338c3] ub_pushRq+0x493 from /u/progress/openedge/117/bin/_mproapsv
#14 [0x433d52] ub_processRequest+0x192 from /u/progress/openedge/117/bin/_mproapsv
#15 [0x4559c4] csd_dispatch_message+0x2d4 from /u/progress/openedge/117/bin/_mproapsv
#16 [0x4444ac] csMtWorkerThreadMain+0x8cc from /u/progress/openedge/117/bin/_mproapsv
#17 [0xea1d6dd5] start_thread+0xc5 from /lib64/libpthread.so.0
** ABL Stack Trace **
--> OERA/support/proSIretrieve.p at line 0 (/u8/rslive/rsserver/Scl/SmartComponentLibrary/OERA/support/proSIretrieve.r)
** Persistent procedures/Classes **
Handle File Name
1061176/u8/rslive/rsserver/Scl/SmartComponentLibrary/Consultingwerk/OERA/FetchDataRequest.r
1061176/u8/rslive/rsserver/Scl/SmartComponentLibrary/Consultingwerk/JsonSerializable.r
1061082/u8/rslive/rsserver/Scl/SmartComponentLibrary/Consultingwerk/OERA/FetchDataRequest.r
1061082/u8/rslive/rsserver/Scl/SmartComponentLibrary/Consultingwerk/JsonSerializable.r
1060424/u8/rslive/rsserver/Scl/SmartComponentLibrary/Consultingwerk/OERA/FetchDataRequest.r
1060424/u8/rslive/rsserver/Scl/SmartComponentLibrary/Consultingwerk/JsonSerializable.r
1060404/u8/rslive/rsserver/Scl/SmartComponentLibrary/Consultingwerk/OERA/FetchDataRequest.r
1060404/u8/rslive/rsserver/Scl/SmartComponentLibrary/Consultingwerk/JsonSerializable.r
1058809/u8/rslive/rsserver/Rs/Automate/Parts/Supersession/Nodes.r
1058808/u8/rslive/rsserver/Rs/Automate/Parts/Supersession/Node.r
PROGRESS stack trace as of Mon Nov 18 15:16:26 2019
Progress OpenEdge Release 11.7 build 1811 SP05 on Linux taurus 3.10.0-957.21.3.el7.x86_64 #1 SMP Tue Jun 18 16:35:19 UTC 2019
Command line arguments are
/u/progress/openedge/117/bin/_mproapsv -logginglevel 2 -logfile /u9/logs/halfway_toyota.agent.log -uburl AppServerDC://0.0.0.0:41445/ -logname halfway_toyota -logentrytypes ASPlumbing,DB.Connects -ubpropfile /u/pas/t_group1/conf/openedge.properties -ASID 2 -ipver IPv4 -sectok XXXXXXXXXXXXXXXXXXXXXX -pf /u8/rslive/rsclient/halfway_toyota/appserver.pf
Startup parameters:
-pf /u/progress/openedge/117/startup.pf,-cpinternal ISO8859-1,-cpstream ISO8859-1,-cpcoll Basic,-cpcase Basic,-d dmy,-numsep 44,-numdec 46,(end .pf),-logginglevel 2,-logfile /u9/logs/halfway_toyota.agent.log,-uburl AppServerDC://0.0.0.0:41445/,-logname halfway_toyota,-logentrytypes ASPlumbing,DB.Connects,-ubpropfile /u/pas/t_group1/conf/openedge.properties,-ASID 2,-ipver IPv4,-sectok XXXXXXXXXXXXXXXXXXXXXX,-pf /u8/rslive/rsclient/halfway_toyota/appserver.pf,-pf /u8/rslive/rsclient/globalappserver.pf,-rereadnolock,-noincrwarn,-mmax 65534,-D 500,-s 128,-h 12,-l 1000,-lkwtmo 120,-yr4def,-q,-T /u9/rstmp,-NL,-tmpbsize 8,-Bt 2500,(end .pf),-db /u8/rslive/database/dwp,-db intdb,-H cronus,-S 10003,-N tcp,-db /u8/EVOLVE/halfway_toyota/commondb,-db /u8/EVOLVE/halfway_toyota/documentdb,-db /u8/EVOLVE/halfway_toyota/dwplocal,-db /u8/EVOLVE/halfway_toyota/retaildb,-db /u8/EVOLVE/halfway_toyota/smartdb,-db /u8/EVOLVE/halfway_toyota/temp-db,-db globaldb,-H cronus,-S 9000,-N tcp,(end .pf)
#1 [0xb35787] uttraceback+0x57 from /u/progress/openedge/117/bin/_mproapsv
#2 [0xb39230] uttrace_withsigid+0x1f0 from /u/progress/openedge/117/bin/_mproapsv
#3 [0xb394c7] utcoreEx+0xc7 from /u/progress/openedge/117/bin/_mproapsv
#4 [0x49b7be] drexit+0x5de from /u/progress/openedge/117/bin/_mproapsv
#5 [0x9d0535] drSigFatal+0xbd from /u/progress/openedge/117/bin/_mproapsv
#6 [0xea1de5d0] __restore_rt+0x0 from /lib64/libpthread.so.0
#7 [0xe922a954] _int_malloc+0x6f4 from /lib64/libc.so.6
#8 [0xe922b9ac] _int_realloc+0x35c from /lib64/libc.so.6
#9 [0xe922d9b2] __GI___libc_realloc+0x1d2 from /lib64/libc.so.6
#10 [0xb2fa32] ut_realloc+0xa2 from /u/progress/openedge/117/bin/_mproapsv
#11 [0x8263de] brExpand+0x7e from /u/progress/openedge/117/bin/_mproapsv
#12 [0x826da8] brGetVarRecIcb+0x68 from /u/progress/openedge/117/bin/_mproapsv
#13 [0x813b50] bfgetEx+0x50 from /u/progress/openedge/117/bin/_mproapsv
#14 [0x81dde3] bfvar+0x73 from /u/progress/openedge/117/bin/_mproapsv
#15 [0x89ded4] rninitpv_setvals+0x324 from /u/progress/openedge/117/bin/_mproapsv
#16 [0x8a41a9] rninitpv+0x89 from /u/progress/openedge/117/bin/_mproapsv
#17 [0x8abfd3] rnproc_entry+0x823 from /u/progress/openedge/117/bin/_mproapsv
#18 [0x88f447] rninterpret+0x37 from /u/progress/openedge/117/bin/_mproapsv
#19 [0x85e262] loadRcode+0x142 from /u/progress/openedge/117/bin/_mproapsv
#20 [0x862984] rnloadObject+0xab4 from /u/progress/openedge/117/bin/_mproapsv
#21 [0x863a48] rnNew_Func+0x1f8 from /u/progress/openedge/117/bin/_mproapsv
#22 [0x4cbfec] fmNEWOBJ+0x4c from /u/progress/openedge/117/bin/_mproapsv
#23 [0x4e6076] fmeval+0x296 from /u/progress/openedge/117/bin/_mproapsv
#24 [0x4e62d2] fmeval+0x4f2 from /u/progress/openedge/117/bin/_mproapsv
#25 [0x88d33d] rnhdlbrnch+0x6d from /u/progress/openedge/117/bin/_mproapsv
#26 [0x88dc66] rnexbr+0x16 from /u/progress/openedge/117/bin/_mproapsv
#27 [0x88e16a] rnexec_entry+0x1ca from /u/progress/openedge/117/bin/_mproapsv
#28 [0x88f447] rninterpret+0x37 from /u/progress/openedge/117/bin/_mproapsv
#29 [0x8c639e] rnudfunc_Exec+0x13e from /u/progress/openedge/117/bin/_mproapsv
#30 [0x8c6f2c] rnudfuncOO_Body+0xdc from /u/progress/openedge/117/bin/_mproapsv
#31 [0x8c8568] rnudfunc_run+0x298 from /u/progress/openedge/117/bin/_mproapsv
#32 [0x8c942a] rnudfuncOOMethod+0xaa from /u/progress/openedge/117/bin/_mproapsv
#33 [0x4ca6ac] fmoo4glRunMethod+0x8c from /u/progress/openedge/117/bin/_mproapsv
#34 [0x4caf96] fmoo4glGetAttr+0x816 from /u/progress/openedge/117/bin/_mproapsv
#35 [0x8527b2] rnwdatrEval+0x202 from /u/progress/openedge/117/bin/_mproapsv
#36 [0x853375] rnwdatrx+0x45 from /u/progress/openedge/117/bin/_mproapsv
#37 [0x4e6076] fmeval+0x296 from /u/progress/openedge/117/bin/_mproapsv
#38 [0x4e62d2] fmeval+0x4f2 from /u/progress/openedge/117/bin/_mproapsv
#39 [0x84d466] rnasgsupersimple+0x156 from /u/progress/openedge/117/bin/_mproapsv
#40 [0x88e16a] rnexec_entry+0x1ca from /u/progress/openedge/117/bin/_mproapsv
#41 [0x88f447] rninterpret+0x37 from /u/progress/openedge/117/bin/_mproapsv
#42 [0x8c639e] rnudfunc_Exec+0x13e from /u/progress/openedge/117/bin/_mproapsv
#43 [0x8c6f2c] rnudfuncOO_Body+0xdc from /u/progress/openedge/117/bin/_mproapsv
#44 [0x8c8568] rnudfunc_run+0x298 from /u/progress/openedge/117/bin/_mproapsv
#45 [0x8c942a] rnudfuncOOMethod+0xaa from /u/progress/openedge/117/bin/_mproapsv
#46 [0x4ca6ac] fmoo4glRunMethod+0x8c from /u/progress/openedge/117/bin/_mproapsv
#47 [0x4caf96] fmoo4glGetAttr+0x816 from /u/progress/openedge/117/bin/_mproapsv
#48 [0x8527b2] rnwdatrEval+0x202 from /u/progress/openedge/117/bin/_mproapsv
#49 [0x853375] rnwdatrx+0x45 from /u/progress/openedge/117/bin/_mproapsv
#50 [0x4e6076] fmeval+0x296 from /u/progress/openedge/117/bin/_mproapsv
#51 [0x84c8a9] rnasgeasy+0x1b9 from /u/progress/openedge/117/bin/_mproapsv
#52 [0x88e16a] rnexec_entry+0x1ca from /u/progress/openedge/117/bin/_mproapsv
#53 [0x88f447] rninterpret+0x37 from /u/progress/openedge/117/bin/_mproapsv
#54 [0x428edf] cr_run_loaded+0x2f from /u/progress/openedge/117/bin/_mproapsv
#55 [0x42bc40] execProc+0x8b0 from /u/progress/openedge/117/bin/_mproapsv
#56 [0x42bf03] execCall+0x33 from /u/progress/openedge/117/bin/_mproapsv
#57 [0x4318dc] WriterOutputRequest+0x36c from /u/progress/openedge/117/bin/_mproapsv
#58 [0x4324f6] open4GLRead+0xb6 from /u/progress/openedge/117/bin/_mproapsv
#59 [0x432bb9] ub_sendRsp+0x169 from /u/progress/openedge/117/bin/_mproapsv
#60 [0x433df1] ub_processRequest+0x231 from /u/progress/openedge/117/bin/_mproapsv
#61 [0x4559c4] csd_dispatch_message+0x2d4 from /u/progress/openedge/117/bin/_mproapsv
#62 [0x4444ac] csMtWorkerThreadMain+0x8cc from /u/progress/openedge/117/bin/_mproapsv
#63 [0xea1d6dd5] start_thread+0xc5 from /lib64/libpthread.so.0
** ABL Stack Trace **
--> Consultingwerk.OERA.Query.QueryString at line 0 (/u8/rslive/rsserver/Scl/SmartComponentLibrary/Consultingwerk/OERA/Query/QueryString.r)
NewDSQueryString Automate.OERA.AutomateDataAccess at line 73 (/u8/rslive/rsserver/Rs/AutomateFramework/Automate/OERA/AutomateDataAccess.r)
InsertToDataSourceQuery Consultingwerk.OERA.DataAccess at line 2626 (/u8/rslive/rsserver/Scl/SmartComponentLibrary/Consultingwerk/OERA/DataAccess.r)
FetchDataInternal Consultingwerk.OERA.DataAccess at line 1923 (/u8/rslive/rsserver/Scl/SmartComponentLibrary/Consultingwerk/OERA/DataAccess.r)
FetchData Consultingwerk.OERA.DataAccess at line 1726 (/u8/rslive/rsserver/Scl/SmartComponentLibrary/Consultingwerk/OERA/DataAccess.r)
FetchData Consultingwerk.OERA.BusinessEntity at line 634 (/u8/rslive/rsserver/Scl/SmartComponentLibrary/Consultingwerk/OERA/BusinessEntity.r)
FetchData Consultingwerk.OERA.BusinessEntity at line 674 (/u8/rslive/rsserver/Scl/SmartComponentLibrary/Consultingwerk/OERA/BusinessEntity.r)
FetchData Consultingwerk.OERA.ServiceInterface at line 646 (/u8/rslive/rsserver/Scl/SmartComponentLibrary/Consultingwerk/OERA/ServiceInterface.r)
OERA/support/proSIretrieve.p at line 529 (/u8/rslive/rsserver/Scl/SmartComponentLibrary/OERA/support/proSIretrieve.r)
** Persistent procedures/Classes **
Handle File Name
419761/u8/rslive/rsserver/Scl/SmartComponentLibrary/Consultingwerk/QueryRowIdentifier.r
419738/u8/rslive/rsserver/Scl/SmartComponentLibrary/Consultingwerk/OERA/FetchDataRequest.r
419738/u8/rslive/rsserver/Scl/SmartComponentLibrary/Consultingwerk/JsonSerializable.r
419722/u8/rslive/rsserver/Scl/SmartComponentLibrary/Consultingwerk/OERA/FetchDataRequest.r
419722/u8/rslive/rsserver/Scl/SmartComponentLibrary/Consultingwerk/JsonSerializable.r
418957/u8/rslive/rsserver/Scl/SmartComponentLibrary/Consultingwerk/OERA/FetchDataRequest.r
418957/u8/rslive/rsserver/Scl/SmartComponentLibrary/Consultingwerk/JsonSerializable.r
PROGRESS stack trace as of Mon Nov 18 15:16:26 2019
Progress OpenEdge Release 11.7 build 1811 SP05 on Linux taurus 3.10.0-957.21.3.el7.x86_64 #1 SMP Tue Jun 18 16:35:19 UTC 2019
Command line arguments are
/u/progress/openedge/117/bin/_mproapsv -logginglevel 2 -logfile /u9/logs/halfway_toyota.agent.log -uburl AppServerDC://0.0.0.0:45422/ -logname halfway_toyota -logentrytypes ASPlumbing,DB.Connects -ubpropfile /u/pas/t_group1/conf/openedge.properties -ASID 11 -ipver IPv4 -sectok XXXXXXXXXXXXXXXXXXXXXX -pf /u8/rslive/rsclient/halfway_toyota/appserver.pf
Startup parameters:
-pf /u/progress/openedge/117/startup.pf,-cpinternal ISO8859-1,-cpstream ISO8859-1,-cpcoll Basic,-cpcase Basic,-d dmy,-numsep 44,-numdec 46,(end .pf),-logginglevel 2,-logfile /u9/logs/halfway_toyota.agent.log,-uburl AppServerDC://0.0.0.0:45422/,-logname halfway_toyota,-logentrytypes ASPlumbing,DB.Connects,-ubpropfile /u/pas/t_group1/conf/openedge.properties,-ASID 11,-ipver IPv4,-sectok XXXXXXXXXXXXXXXXXXXXXX,-pf /u8/rslive/rsclient/halfway_toyota/appserver.pf,-pf /u8/rslive/rsclient/globalappserver.pf,-rereadnolock,-noincrwarn,-mmax 65534,-D 500,-s 128,-h 12,-l 1000,-lkwtmo 120,-yr4def,-q,-T /u9/rstmp,-NL,-tmpbsize 8,-Bt 2500,(end .pf),-db /u8/rslive/database/dwp,-db intdb,-H cronus,-S 10003,-N tcp,-db /u8/EVOLVE/halfway_toyota/commondb,-db /u8/EVOLVE/halfway_toyota/documentdb,-db /u8/EVOLVE/halfway_toyota/dwplocal,-db /u8/EVOLVE/halfway_toyota/retaildb,-db /u8/EVOLVE/halfway_toyota/smartdb,-db /u8/EVOLVE/halfway_toyota/temp-db,-db globaldb,-H cronus,-S 9000,-N tcp,(end .pf)
#1 [0xb35787] uttraceback+0x57 from /u/progress/openedge/117/bin/_mproapsv
#2 [0xb39230] uttrace_withsigid+0x1f0 from /u/progress/openedge/117/bin/_mproapsv
#3 [0xb394c7] utcoreEx+0xc7 from /u/progress/openedge/117/bin/_mproapsv
#4 [0x49b7be] drexit+0x5de from /u/progress/openedge/117/bin/_mproapsv
#5 [0x9d0535] drSigFatal+0xbd from /u/progress/openedge/117/bin/_mproapsv
#6 [0xe27ee5d0] __restore_rt+0x0 from /lib64/libpthread.so.0
#7 [0x5d954c] doMoreSchemaCheck+0x2cc from /u/progress/openedge/117/bin/_mproapsv
#8 [0x5d9e58] csoGetSchRequest+0x388 from /u/progress/openedge/117/bin/_mproapsv
#9 [0x42d0bc] getSchemaItem+0x1c from /u/progress/openedge/117/bin/_mproapsv
#10 [0x430d1e] ReaderInputRequest+0x19e from /u/progress/openedge/117/bin/_mproapsv
#11 [0x432674] open4GLWrite+0xe4 from /u/progress/openedge/117/bin/_mproapsv
#12 [0x432784] open4GLWriteLast+0x84 from /u/progress/openedge/117/bin/_mproapsv
#13 [0x4338c3] ub_pushRq+0x493 from /u/progress/openedge/117/bin/_mproapsv
#14 [0x433d52] ub_processRequest+0x192 from /u/progress/openedge/117/bin/_mproapsv
#15 [0x4559c4] csd_dispatch_message+0x2d4 from /u/progress/openedge/117/bin/_mproapsv
#16 [0x4444ac] csMtWorkerThreadMain+0x8cc from /u/progress/openedge/117/bin/_mproapsv
#17 [0xe27e6dd5] start_thread+0xc5 from /lib64/libpthread.so.0
** ABL Stack Trace **
--> OERA/support/proSIretrieve.p at line 0 (/u8/rslive/rsserver/Scl/SmartComponentLibrary/OERA/support/proSIretrieve.r)
** Persistent procedures/Classes **
Handle File Name
220058/u8/rslive/rsserver/Scl/SmartComponentLibrary/Consultingwerk/OERA/FetchDataRequest.r
220058/u8/rslive/rsserver/Scl/SmartComponentLibrary/Consultingwerk/JsonSerializable.r
219957/u8/rslive/rsserver/Scl/SmartComponentLibrary/Consultingwerk/OERA/FetchDataRequest.r
219957/u8/rslive/rsserver/Scl/SmartComponentLibrary/Consultingwerk/JsonSerializable.r
217926/u8/rslive/rsserver/Scl/SmartComponentLibrary/Consultingwerk/Framework/Collections/CharacterDictionary.r
217926/u8/rslive/rsserver/Scl/SmartComponentLibrary/Consultingwerk/Framework/Base/AblPrimitiveDictionary.r
217924/u8/rslive/rsserver/Scl/SmartComponentLibrary/Consultingwerk/Framework/Collections/CharacterDictionary.r
217924/u8/rslive/rsserver/Scl/SmartComponentLibrary/Consultingwerk/Framework/Base/AblPrimitiveDictionary.r
217923/u8/rslive/rsserver/Rs/Automate/Vehicles/Franchise/VehiclesFranchiseDataAccess.r
217923/u8/rslive/rsserver/Rs/AutomateFramework/Automate/OERA/AutomateDataAccess.r
217923/u8/rslive/rsserver/Scl/SmartComponentLibrary/Consultingwerk/SmartFramework/SmartDataAccess.r
217923/u8/rslive/rsserver/Scl/SmartComponentLibrary/Consultingwerk/OERA/DataAccess.r
217787/u8/rslive/rsserver/Rs/Automate/Vehicles/Franchise/VehiclesFranchiseBusinessEntity.r
217787/u8/rslive/rsserver/Rs/AutomateFramework/Automate/OERA/AutomateBusinessEntity.r
217787/u8/rslive/rsserver/Scl/SmartComponentLibrary/Consultingwerk/OERA/BusinessEntity.r
217145/u8/rslive/rsserver/Scl/SmartComponentLibrary/Consultingwerk/OERA/FetchDataRequest.r
217145/u8/rslive/rsserver/Scl/SmartComponentLibrary/Consultingwerk/JsonSerializable.r
217125/u8/rslive/rsserver/Scl/SmartComponentLibrary/Consultingwerk/OERA/FetchDataRequest.r
217125/u8/rslive/rsserver/Scl/SmartComponentLibrary/Consultingwerk/JsonSerializable.r
213562/u8/rslive/rsserver/Scl/SmartComponentLibrary/Consultingwerk/OERA/FetchDataRequest.r
Hi Mark,
please open a support request. Please add the protrace information and any log files you have when the protrace files were created.
Thank you, Roy
Have you tried hosting PASOE on Windows for comparison? We have been running PASOE 11.7.5 on Windows Server for quite a while and don't have these types of errors. Or rather, after we turn off DEP and antivirus we don't have them.
I'm a bit confused by the environment. Are you saying that PASOE and your OE database are hosted remotely from each other? That would surprise me. But I could understand if your PASOE *clients* (APSV, SOAP and other transports) may be remote since they are all connecting over standard HTTP to tomcat.
... based on my experience you will have lots of trouble if the PASOE instance is not in the same datacenter as the OE database. The "client/server" protocol for interacting with the OE database is not a great fit for connectivity over a WAN. I can certainly see why this would be problematic.
However I cannot understand why classic appserver would have been any different than PASOE where this client/server connectivity is concerned.
I would be very interested to hear the solution. We also use PASOE in a WAN environment but perhaps not the same way you do.
Hi dbeavon
Just to clarify, the PASOE and OE database is hosted on the same Linux server (shared memory connection). The users are connecting over a WAN connection to our Data center.
Unfortunately, we have been forced to move the customer back onto the classic appserver until we can get this resolved. As soon as I can get my account to work, I will be logging a ticket with Progress support.
After moving this client back onto the classic appserver there has been a noticeable performance increase. This is also clearly apparent on the average CPU load as it as dropped considerably since moving them.
With just over 200 user connections we configured the classic appserver with min and max agents set to 14. I could even down scale this to 5 agents and it would still be more than enough to process user requests.
When moving over to PASOE I used the following parameters
maxABLSessionsPerAgent=200
maxAgents=2
maxConnectionsPerAgent=10
numInitialAgents=2
numInitialSessions=8
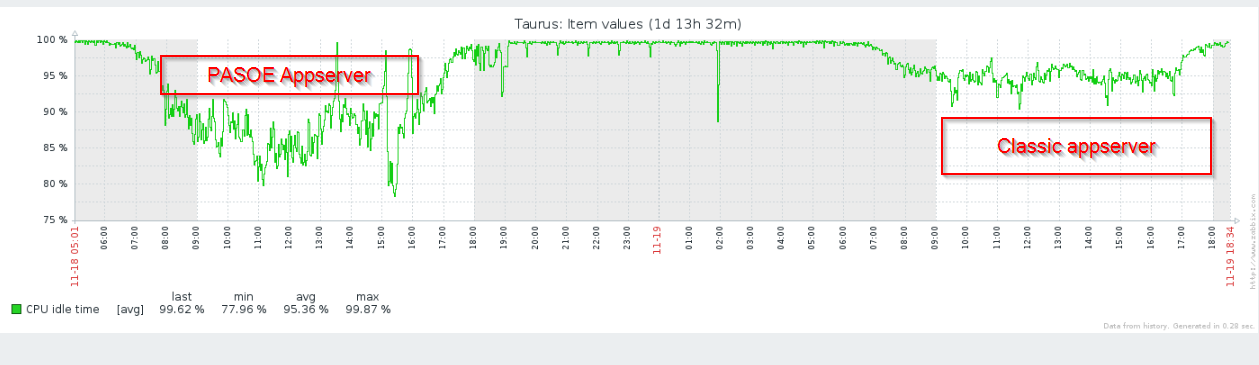
That is an interesting chart. I'm assuming that it is the same hardware configuration for PASOE and classic.
Can you isolate the processes that are consuming the most cpu? I would guess that it is a combination of tomcat process and the _mproapsv(s). But it would be good for you to confirm that. (Sometimes I find that some totally unexpected thing is consuming CPU, like antivirus or cron jobs, or whatever) Also, would you be able to perform some artificial load-testing? Ideally this this activity could be simulated and so that you would have the opportunity to dive into the problem in more depth.
In my experience PASOE is a good technology and scales out well. Our round-trip times for APSV requests can get down to around 5 ms when everything is in the same datacenter (even if we are using client/server rather than "shared memory"). The scalability and fault-tolerance of PASOE can be improved by moving PASOE to its own (load-balanced) hosts and switching over to client/server DB connectivity. Of course some parts of the application design may need to be "revisited" in order to accommodate the client/server connectivity to the database.
If I understand correctly, for both classic and PASOE you are running the appserver on the same host as the database, with a shared memory connections. The remote clients are using the APSV transport in both cases, and are connected very distantly (over the WAN from another continent).
If that is correct then I think you are dealing with at least two different issues. I would suggest breaking the issues apart and working on them separately. Your application crashes, first of all, seem to be happening while interacting with the OE database in shared memory on a single host (both in the case of "classic" and PASOE):
--> Consultingwerk.OERA.Query.QueryString at line 0 (/u8/rslive/rsserver/Scl/SmartComponentLibrary/Consultingwerk/OERA/Query/QueryString.r) NewDSQueryString Automate.OERA.AutomateDataAccess at line 73 (/u8/rslive/rsserver/Rs/AutomateFramework/Automate/OERA/AutomateDataAccess.r)
Conceptually this data-access between _mproapsv and the shared memory database should not work any differently than it would between _proapsv and the shared memory database. The only difference is that _mproapsv can host multiple sessions in one process, and _proapsv hosts only a single session per process. I'm not sure I've heard of a lot of bugs that would affect _mproapsv shared-memory connectivity, but not the corresponding _proapsv shared-memory connectivity. Maybe it is worth googling? Another thing that might be helpful is to check and see if switching to client-server (-H -S) would avoid the crashing. We connect to the database strictly via client-server, and we only run PASOE on windows. Perhaps one of those two things is making the difference and prevents us from seeing the crashing.
The second problem you are experiencing seems to be performance issues (and related network drops). I'm assuming you are suspicious of the APSV transport between tomcat and the (very) remote appserver clients. Those types of issues should generally show up in the PASOE "session-manager" logs, written on behalf of tomcat sessions. I would scrutinize the session-manager logs (and *not* so much the agent logs). Again the crashing of your msagents is probably not directly related to performance/network issues (since the msagent interaction is with the *database*, and not with the remote PASOE clients). It is the tomcat server that is interacting with remote clients across the WAN. To troubleshoot the remote APSV clients, you might consider installing the "manager" webapp into pasoe since that could give you better visibility over remote clients. You can also turn up logging for the APSV transport in pasoe. see kb:
Hopefully this helps. I'd be interested to hear your performance comparisons again after you have successfully made the switch to PASOE.
I'm assuming that it is the same hardware configuration for PASOE and classic. The hardware is exactly the same and with no other configuration changes
Can you isolate the processes that are consuming the most cpu? The _mproapsv process is consuming the bulk of the CPU load on the Linux server which is hosting both the DB and Appserver.
"If I understand correctly, for both classic and PASOE you are running the appserver on the same host as the database, with a shared memory connections. The remote clients are using the APSV transport in both cases, and are connected very distantly (over the WAN from another continent)." Correct, geographically the server is hosted in our Data Center here in South Africa and all the connections are local via a WAN connection.
If that is correct then I think you are dealing with at least two different issues. I would suggest breaking the issues apart and working on them separately. Your application crashes, first of all, seem to be happening while interacting with the OE database in shared memory on a single host (both in the case of "classic" and PASOE): Yes I do believe we are dealing with two different issues here. One is the disconnect and the other is performance related. We are not experiencing the same issue with "classic". The classic appserver seems to handle these "disconnected sessions" more gracefully.
It is worth noting that we have moved several customers over to PASOE over the past year and a half with good success. The only difference is that these customers are what we call "in-house" customers whereby they host their own servers onsite so most of these clients have been connecting over a LAN. From a user count these have also been relatively small so the comparison is not quite the same.
I think I've gone through all the PASOE performance documents that has been published (including the links that Roy Ellis provided). I've applied various configurations, none of which gets me even close to classic appserver model baring one configuration change.
If I increase the amount of agents and limit the agents to 2 sessions each i start seeing a noticeable improvement on the CPU load. This forces requests to be serviced by multiple agents rather than just one. The way I see it i'm essentially mimicking the classic appserver model which kind of defeats the point. The expectation is that the multi threading agents should provide much better performance and provide better scalability. I'm not seeing either.
With roughly another 200 Databases to migrate over to PASOE, I'm reluctant to move any of them until I can address the performance/load issues we are currently experiencing.
Did you fix the crashing while the ABL is interacting with the database? That seemed like the biggest concern! (And one that should NOT have anything to do with your particular infrastructure). It seems like that would be affecting *all* PASOE customers who are using shared memory connections to their databases. I'm surprised that type of problem hasn't been reported before...
How are the remote APSV connections made? From the .net or java openclient? Also do you have the "HTTP sessions" enabled? (Which are unrelated to the "ABL sessions" within an msagent.) You might want to take measurements of how long it takes before client connections are broken. Some of this might be related to tomcat timeouts or some such thing. We had trouble with this as well, and the troubles are based on the differences in the way that sessions are managed in classic vs PASOE.
We still haven't switched this particular customer back to PASOE even though we suspect it was their antivirus that was causing the issue. They are running ESET antivirus software and it seems that when "Enable HTTP protocol checking" is enabled it causes random disconnects from the client which we suspect was causing corruptions on the PASOE sessions. We were able to reproduce the sudden disconnects by installing a version of their antivirus but we have not been able to reproduce the "corruption" on the sessions.
Since they have been running on classic they have reported that the performance is much better. I need to resolve performance issue before I consider moving them back. I've run some closed system testing and I can see first hand the difference from switching from classic to pasoe. The round trip for each request is noticeably faster when working on a classic model vs PASOE. When I have a gap I will try and post a video of exactly what I mean.
All our clients connect via Webclient and the "HTTP sessions" is enabled as per default. When I read your response you had me thinking that it might be the version of webclient we are running. As we are running Webclient 11.5 I decided to test with Webclient 11.7 but unfortunately I"m seeing exactly the same response times when performing some basic application tests.
I've now dumped and loaded the DB onto my laptop running Windows 10 and OE 11.7. I created the PASOE instance using a shared memory connection and the result is night and day. Overall performance is much much better. If I can now get the same result on our Linux server life will be great.
Since i'm running vanilla OE 11.7 on Windows i'm going to install the same vanilla version on our production server (currently on 11.7.4) and see if maybe there is something in SP4 that is hindering the performance.
That's not what I would have expected to hear. But it is very interesting. If you are going to spend a lot more time running Windows, please remember to disable antivirus and DEP (data execution prevention). Both of those will make Windows slower as compared to Linux, and may generate some strange errors as well!
I suspect you will start hearing from others in this forum that you are doing something wrong in Linux. I think Progress customers use Linux more than Windows (probably ~50% Linux to ~35% Windows if I had to guess).
Either way, if you get to the bottom of your problems, you may want to submit your findings to Progress tech support so that a KB can be written for the benefit of the Linux community. It sounds like you may be running into a configuration issue (Nagle's algorithm or autocorking preferences or similar). Although these would be related to TCP connectivity ... they don't impact your shared memory database connections in any way.
If it helps, here is a recent link about someone running into performance issues on Linux. community.progress.com/.../59926
Again this was in relation to TCP client/server connection to the database. The configuration issue in this case wouldn't apply to you when using shared memory connections. But maybe it could impact PASOE/tomcat in some way? I don't know Linux very well so it is just a guess.
I appreciate all the suggestions and comments. I'm optimistic that I will find a solution and I will certainly post my findings once resolved.
I'm not that familiar with webclient. Did you search the KB? There may be other customers who have experiences with this. For example, the following article seems to imply the presence of unresolved issues with the webclient:
Is that one yours? It was created in April 2019.
We are using the APSV transport (.Net openclient) to PASOE. There were a couple support cases I had to open for APSV when I first started migrating to PASOE . It wouldn't surprise me if you had discovered/rediscovered a bug in the webclient too (like the one referenced in the KB article above).
I've read that article but the symptoms are not quite the same. We know for certain that some of our customers have connectivity issues. The issue here is how PASOE deals with these connections when they are dropped. I've been running numerous tests over the last few days have come up with some interesting results.
I've now tested on Centos 6 and Centos 7 ending up with the same poor performance. Both tests have been from a fresh install of both operating systems with OE 11.6.4 and 11.7.5.
After getting great results from windows I decided to direct the PASOE instance from Windows to Centos DB server. In conclusion the end result was better than either the shared connection of PASOE and that of the Classic appserver. This left me thinking it is either the Tomcat or the shared memory connection on Linux that is the issue. I then created a client server connection from the Linux server to the DB (on the same server) just to rule out the shared memory connection and ended up with the same poor performance. This now leaves me to believe that is has something to do with transport of Tomcat to the DB.
I've reported all my finding along with videos of each test on the case number with Progress.
As a final test I've installed centos 8 (Server with no GUI). I immediately got an error trying to start the PASOE instance but fortunately the log file pointed me in the right direction saying that it was missing the libnsl package. After installing the required package I was able to fire it up and the performance is pretty much the same now as on Windows. If any anyone can share light on this it would be greatly appreciated as we are not quite ready to upgrade all our servers to Centos 8 as yet.
I've now narrowed down the issue to multiple CPU's/Threads on a server.
Our servers are hosted on VMWARE Infrastructure. On both production and test I've been allocating 4 or more CPU's per guest. This results has been poor PASOE performance. When I brought down the CPU allocation on my test environment down to 1 the performance was much better.
In my post before I mentioned that I got better performance when installing Centos 8. This was true because I ran the test within Hyper-v on my local machine. I allocated the default number of CPU's "1". If I now increase this number to 4 I end up with the same poor performance.
I've included my recent finding in the case I've logged with Progress.
That is interesting that more CPU's causes an overall performance decrease. Have you turned up tracing (4GLTrace) and review the timing differences in both cases? Another interesting thing would be to set the max sessions per agent to "1" and see if multiple PASOE agent processes would perform as well as they did in "classic". With only *one* PASOE agent per session (_mproapsv), the result might be similar to when there was only ever one _proapsv per session in the past (in "classic").
There aren't that many resource conflicts between the independent sessions (threads) in a PASOE process (_mproapsv) but I know of a few (eg. xml, clr bridge). You may have introduced your own resource conflict via a custom or third-party component.
Can you repro the problem when VMWare is removed from the equation? (IE. repro on a physical host with more than one core)? If VMWare is a necessary factor to cause the problem then Progress may not want to work on this. I suspect Progress OE is totally agnostic about whether you are running on a VM or a physical. The problem could just as well be sent to VMWare.
This might not be a PASOE problem. It could also be an issue with your VM configuration. Especially if you have more virtual CPUs allocated than there are actual cores. (Remember - HT cores are not real.) It may not even be the VM that you are testing with. Suppose, for instance, that your physical machine has 8 cores. If there is some other VM with 6 "virtual cpus" then every time it gets scheduled it uses 6 cores. Leaving just 2 for everything else. If you need 4 then you will have to wait until that other VM is no longer running.
On an earlier post I did mention the following
"If I increase the amount of agents and limit the agents to 2 sessions each i start seeing a noticeable improvement on the CPU load. This forces requests to be serviced by multiple agents rather than just one. The way I see it i'm essentially mimicking the classic appserver model which kind of defeats the point. The expectation is that the multi threading agents should provide much better performance and provide better scalability. I'm not seeing either?"
I'm trying to get my hands a physical machine to run similar tests.
It is interesting that both Hyper-V and Vmware are giving me the same results. I can't be alone with this issue.
I still need to increase the 4GLtrace to examine the timing.
Hi Tom.
The VM infrastructure is rather new and it pretty much idle at this stage so i'm pretty sure I haven't over committed on resources. I've also ruled this out by running a centos guest on my Hyper-v setup on my laptop. The result is exactly the same.
The only feedback i've got from Progress at this stage is the following article.
I don't believe this is my problem as i'm not experiencing the same issue when moving back to Classic on the same kit with shared memory connections. I've also tested a client server connection on the same Linux guest and ended up with the same poor performance.
If I create a PASOE instance on Windows (on same VM Infrastructure) and then point it to the Linux DB server the performance is much better. This issue seems to be specific to running PASOE on Linux.
>>If I increase the amount of agents and limit the agents to 2 sessions each i start seeing a noticeable improvement on the CPU load. This forces requests to be serviced by multiple agents rather than just one.
So this tells me that the problem is not related to the virtual machine. It has to do with the fact that your ABL sessions are sharing living space with one another within the _mproapsv process. They are conflicting with each other and they should not be (except for certain rare scenarios that are well-known, eg for xml and the clr bridge).
I would definitely review your 4GLTrace outputs and isolate the specific parts of code that get unreasonably slow. You might even try some artificial tests that (1) eliminates the database access altogether, or (2) switch from shared memory to client-server connectivity.
I suspect you have some code or component that makes a bad assumption, given the nature of PASOE (eg. the ABL code might be assuming that it has an entire process/ID/resource/static all to itself).
Hi Brian,
These are the specs:
VMware ESI, 6.7.0
3 x PowerEdge R640
2 x Intel Gold 6140 CPU @ 2.30GHz per server
QLogic 2692 Dual Port 16Gb Fibre Channel HBA, Low Profile
PERC H730P RAID Controller, 2GB NV Cache, Mini card
Intel X550 Quad Port 10GbE, Base-T, rNDC"
Logical Processors 72 Per server
768 Mb Memory per server
Storage
UNITY 350F ALL FLASH
RAID 5 Thin provisioning
Test Guest Config
CPU 6
Cores per Socket 6
Memory 6Gb
Network adapter VMXNET 3
Unfortunately I won't be able to power down any of these server anytime soon.
As mentioned I got the same result running a centos guest on Hyper-v on my laptop. Also, no issues running classic appserver on same DB.
I should have time tomorrow to test on a physical machine. I will post my finding.
Hi dbeavon
Just to clarify, when reducing the number of sessions to 1 this only reduces the cpu load but does not improve the performance. I will be analyzing the 4GLtrace today and see what I can find. As mentioned I have tested client server connection (linux to linux) and this was also slow. If i setup a client server connection from a Windows PASOE connection to the DB it is fast. I will still get one of our developers to review the code just to rule that out anyway.
Hi Brian,
I've now tested on a physical machine (Intel i7 8 cores) and ended up with the same poor performance while running PASOE on Linux
I though I would provide an update on the case that I opened with Progress.
They have been able to recreate the issue with the following results as logged by the support engineer.
After enabling Tomcat DEBUG logging on ALL classes and sub-components I could identify com.progress.O4gl.Broker.readMsg() as the method responsible for the performance drop in the 4-core environment:
side-by-side log comparison:
** Bottleneck 1 **
* 4 core PASOE environment *
06:58:59.252/636957 [catalina-exec-7] DEBUG com.progress.appserv.Timing - WRITEAGENTREQUEST(m0-TY9s3TneYLHQHq7ozeQ,SESSION<1mZNhYRZTrKoSTXSDOxH5Q>) RQID<null>
06:58:59.252/636957 [catalina-exec-7] DEBUG com.progress.O4gl.Broker - readMsg()
06:58:59.366/637071 [catalina-exec-7] DEBUG com.progress.O4gl.Broker - readubhdr
> 114ms
** versus1 core PASOE environment **
06:09:03.533/1129666 [catalina-exec-9] DEBUG com.progress.appserv.Timing - WRITEAGENTREQUEST(STmp59lfS1WP2qqi5rgZAw,SESSION<1HRbHTt4QBOcMeS2Rk8P-w>) RQID<null>
06:09:03.534/1129667 [catalina-exec-9] DEBUG com.progress.O4gl.Broker - readMsg()
06:09:03.545/1129678 [catalina-exec-9] DEBUG com.progress.O4gl.Broker - readubhdr
> 11 ms
** Bottleneck 2 **
* 4 core PASOE environment *
06:58:59.383/637088 [catalina-exec-8] DEBUG com.progress.appserv.Timing - WRITEAGENTREQUEST(m0-TY9s3TneYLHQHq7ozeQ,SESSION<1mZNhYRZTrKoSTXSDOxH5Q>) RQID<null>
06:58:59.383/637088 [catalina-exec-8] DEBUG com.progress.O4gl.Broker - readMsg()
06:58:59.959/637664 [catalina-exec-8] DEBUG com.progress.O4gl.Broker - readubhdr
> 576 ms
* versus1 core PASOE environment *
06:09:03.585/1129718 [catalina-exec-10] DEBUG com.progress.appserv.Timing - WRITEAGENTREQUEST(STmp59lfS1WP2qqi5rgZAw,SESSION<1HRbHTt4QBOcMeS2Rk8P-w>) RQID<null>
06:09:03.585/1129718 [catalina-exec-10] DEBUG com.progress.O4gl.Broker - readMsg()
06:09:03.741/1129874 [catalina-exec-10] DEBUG com.progress.O4gl.Broker - readubhdr
> 156ms
They are still trying to rule out if it is a JVM issue but I doubt that that is the case since the same version of JDK running on Windows performs as expected.
I am curious to know if anyone else is running PASOE on Linux and if they are experiencing similar issues. The results are the same when testing on 11.6 and 11.7.
>> They have been able to recreate the issue with the following results as logged by the support engineer.
Recreating the issue on their end is usually the key step. They need to do that before they can really dig into it. They have all the source code and they can now do the profiling to find the underlying source of the delay. It shouldn't be long now. Those are fairly massive delays and I would think it should be easy to find the related java callstacks in "visual vm" or "mission control" or whatever. You could probably do that yourself, and investigate their decompiled java code if you really cared to.
If this isn't a corking or nagle issue then it may be concurrency related. It wouldn't surprise me if there were some unintentional concurrency conflict that they had introduced in their code ("com.progress.O4gl.Broker" or whatever).
Off the top of my head I can think of three other concurrency conflicts I've dealt with in PASOE... there is one related to using XML from multiple ABL sessions, there was one related to initializing the "clr bridge" from multiple ABL sessions at once (that has been fixed), and there is one related to the concurrent use of the "generic JMS" adapter (this is still an active support ).
I'm surprised that other linux customers haven't complained about this too. My understanding is that Linux is the primary platform for OE ... for example they have done work to support docker containers on Linux but nothing like that has happened on Windows yet .
Did they tell you the purpose of "readMsg" in "com.progress.O4gl.Broker"? It sounds like it is doing some IPC communication with the _mproapsv processes. If that IPC relies on TCP/IP then I would still suspect an issue related to corking or nagle. Hopefully they can fix it and there will a lot of grateful Linux folks. We had a nagle issue with the "classic" appserver on HP-UX but it didn't affect other platforms (linux or windows). It added a fairly substantial delay (100's of ms). That was fixed a couple of years ago. But that was less impactful... there probably aren't a lot of HP-UX customers anymore (and I suspect that even if there were still a few HP-UX customers, they would probably be oblivious ... )
Did they tell you the purpose of "readMsg" in "com.progress.O4gl.Broker"? It sounds like it is doing some IPC communication with the _mproapsv processes. If that IPC relies on TCP/IP then I would still suspect an issue related to corking or nagle. Hopefully they can fix it and there will a lot of grateful Linux folks. We had a nagle issue with the "classic" appserver on HP-UX but it didn't affect other platforms (linux or windows). It added a fairly substantial delay (100's of ms). That was fixed a couple of years ago. But that was less impactful... there probably aren't a lot of HP-UX customers anymore (and I suspect that even if there were still a few HP-UX customers, they would probably be oblivious ... )
I've tried enabling that parameter but it doesn't seem to make any difference if I set the value to 1 or 0. I'm sure under certain conditions it does have an impact.
It is concerning that this issue has gone under the radar for so long. I really hope the DEV team can come up with a solution.
Did they tell you the purpose of "readMsg" in "com.progress.O4gl.Broker"?
I never actually asked. I think I was just happy that they managed to pinpoint where the issue is. I'm just worried that they are now questioning whether it is a JVM issue.
>> They have been able to recreate the issue with the following results as logged by the support engineer.
Did they get to the bottom of this, since the time you provided tech support with the full repro? Do you still think it the issue applies to other Linux customers as well? Or just you?
I'm hoping that, even as a windows user of PASOE, we might find something we can do to improve performance. It is always nice when a simple configuration change is all that is needed to make things run faster. it reminds me of the days when computers had a "turbo" button. en.wikipedia.org/.../Turbo_button ... I don't know anyone that didn't push that button.
Sorry I was meant to provide feedback a lot sooner. We eventually got to the bottom of this. It turns out that OS commands from ABL code is 10 times slower when running on PASOE. For every appserver call we were trying obtain the PID which explained the very poor performance we were getting on a multi-core environment. The KB has been updated with the article below.
The KB could be a bit more informative.
Cause: "There is unnecessary sleep time when forking a process and waiting for it to exit."
It seems this deserves a bit more discussion, for the benefit of those of us who already distrust the migration from one platform to another or from one appserver product to another. Artificial sleep statements are especially prone to conspiracy theories. If I recall correctly, I think Apple recently sent out an OS update to the older iPhones so that they would all run slower, and prompt every iUser would to go buy a newer one. I think they said they did this to "extend battery life". You gotta love that creative explanation!
Did they happen to explain why they put an extra sleep statement on the PASOE side but not on classic? Or why it is in Linux but not on Windows?
It reminds me of the 300% improvement in performance on the database side of things too (IE. probably a result of eliminating the sleep/waits in the "time-slicing" behavior of the _mprosrv processes.)
>> there is no need to worry about thread starvation and it just blocks
So why can't PASOE "just block"? If I read the explanation on that side of things, it seems you are saying that the wait on a forked process is a high-CPU operation? That doesn't make much sense. Doesn't the operating system have some kind of notification to wake up the parent process (parent thread) when a child process ends?
As a side, I do appreciate the fact that these things aren't normally done for a malicious reason. The problem from my perspective is that people may use performance to say that Windows is better than Linux or vice-versa and, in the end, the difference may be as simple as the fact that one of them has a sleep statement that the other doesn't. When we were considering where to move our OE databases (currently on HP-UX) there were people (even some Progress experts) who said Linux is "10%" superior where performance is concerned compared to Windows. When you ask what the 10% overhead consists of - network, disk I/O, or whatever - and they can't/won't tell you for certain.... In the end, it might be that a sleep statement has been introduced in one and not the other (for whatever good or bad reason).
Another problem with these types of cases is how hard it is to escalate performance problems when working with tech support (for any software vendor). These cases can be hard to repro consistently and, even when you do, they are much lower priority than anything else that the vendor may be working on. Memory leaks are the same way. I don't think Progress tech support wants to investigate PASOE memory leaks unless they are *extremely* rapid leaks (eg. 100's of MB per _mproapsv per day).
>> I don't think Progress tech support wants to investigate PASOE memory leak
That isn't totally accurate ... tech support was very helpful when I had a larger leak. And when I isolated the repro myself.
But now that my _mproapsv processes only grow to about 4 or 5 GB in a week, they seem a bit less inclined to help investigate (...especially if I cannot independently pin-point the lines of ABL code in our environment that are responsible). Of course this is the extremely hard part when the memory leaks slowly over the course of an entire week.
In the .Net world I can do lots of other things to find my own leaks - even gradual ones - like open up memory dumps on my own. It is frustrating that I don't have quite the same tools in ABL - especially since when the leak is typically in native code (msagent process host, and not my custom ABL).
>>Would be happy to look at any examples
I am not an expert, and have not programmed outside of managed environments. This is not really a memory management topic, however, so I will at least point you to something comparable in .Net. The .Net runtime has an abstraction in "system.diagnostics.process" that allows you to launch a process and wait for it. It appears to be available on .Net Core and should work on Linux (but I've never tried).
That abstraction of a process in .Net has a method "waitforexit" and I have used it a lot, but never observed any CPU implication. It is possible that a CPU cost is present but it is probably minimal (ie. maybe they use a comparable algorithm). You could google "waitforexit .net cpu" and see if there are any complaints about their approach. I'm sure someone would have complained by now if this consumed CPU.
Anyway all this stuff should be open source and nowadays (MIT license) so I think it is free to borrow whatever you need from it. Here are the API notes for .net core:
docs.microsoft.com/.../system.diagnostics.process.waitforexit
There are also a couple of ABL examples for enabling/disabling and accessing the output from this feature that are provided in the following two articles:
knowledgebase.progress.com/.../PASOE-Dynamic-Objects-Viewer
knowledgebase.progress.com/.../PASOE-Dynamic-Objects-Viewer-for-TTY-interfaces
Yes, I know about that. Our memory leaks go deeper than that. Typically the memory appears to be consumed by r-code in the heap, based on what I can tell when flailing around with windbg.
We trim ABL sessions entirely so that there is *nothing* of ours that remains in the _mproapsv processes (only Progress stuff). This is especially true in the evenings when things are idle and there are long periods when _mproapsv has no ABL sessions. Aside from the CLR bridge we don't use memory outside of the normal AVM. I am quite sure we aren't use weird MEMPTR or something that might out-live any given ABL session.
There is an extremely small leak within the managed memory of the CLR (related to bridge components), but that is not the leak I care about. The leak that concerns me is in unmanaged memory.