
Hello,
I am trying to see if I can improve the performance of our application which runs on Progress 10.2B.
We have a new HP DL380 Gen10 with ESXI 6.7 and RAID 10, on it I have a Server 2012 VM with Progress v10.2B and a Windows 10 VM with our client application on which connects to the Progress database on the server. For testing I have both the server and the client connected to the same vSwitch so that the network speed between them is around 5Gbps.
If I open up the application on the client and select quite a large number of records it takes around 40 seconds to bring them back. If I monitor performance on both the server and the client whilst I am doing this nothing maxes out, the CPU, RAM and disk usage seems low. The network usage goes to about 10Mbps but I have a 5Gbps connection!
So why are all of the hardware’s capabilities not being used, what is stopping it using more CPU, RAM, disk and network? Are there any other configuration options I can use to speed the database up?
Thanks for any help
Seems an odd decision not to upgrade Progress version at the same time as upgrading the server, but that aside, you should at least make sure you have service pack 8 installed as that has a few improvements.
It would be helpful to know what the database startup parameters are as well as other configurations such as DB block size etc. In particular as a starting point you'll want to look at your -Mm parameter, and the various -prefetch parameters to help use the network more.
Hello James,
Unfortunately we are tied to an application which at the moment is only supported on Progress 10.2B so this is something we just can’t change. The application and the database are supported by an external company, I have very little Progress knowledge but think that it could run faster and so just want to find out a little more about it.
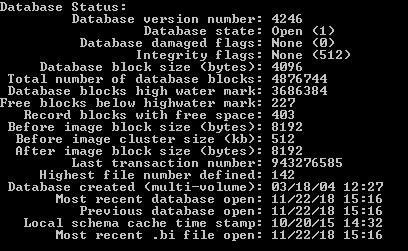
Below is the information I have found about the database I think this is what you were asking for.
_mprosrv distrib -N TCP -S 2513 -n 10 -Mn 11 -Mi 5 -Ma 5 -Mpb 2 -B 100000 -L 700000 -evtlevel brief -ServerType SQL -PendConnTime 10
_mprosrv distrib -m3 -Mi 3 -Ma 5 -Mpb 8 -S 2511 -ServerType 4GL -PendConnTime 10
_mprshut distrib -C watchdog
Thanks
A bigger network packet would probably help.
-Mm 8192
Best added to the startup.pf files for both client and server.
There are other parameters - some of which are only available for Enterprise database. Do you have Workgroup or Enterprise?
So the primary broker is for SQL connections. Is that also the primary connection type for the application?
-B 100000 is small. Is this 32 bit or 64 bit Progress executables on the server?
-L 700000 suggests there could be transaction scoping issues in the application.
I should have asked earlier, what RDBMS license is this? Workgroup, Enterprise or Advanced Enterprise?
Search our KB for "vmware" and ensure you follow the articles which talk about performance.
You also want to ensure that the VM's are using the vmxnet3 network driver.
We are using a Workgroup licence, I'm fairly sure it's 64bit, I'm not sure of the primary connection type for the application. It does have service pack 8.
I tried increasing the network packet size with that setting but it didn't make a noticeable difference. The Vm's are on vmxnet3.
Thanks
Workgroup is going to be very limiting. Increasing the packet size isn't going to help you much as they will still only get the same default amount of data stuffed into them without being able to tweak all of the buttons under the hood. -lruskips is also not available to you. You also won't be able to change -spin which could help performance in conjunction with some other changes.
How big is the database on disk? The only real parameter you may benefit from increasing off the top of my head without further investigations would be -B. Assuming you are actually on a 64bit executable then you can increase this quite drastically, if you have the RAM available. The number here is the number of database blocks to use as a buffer in memory. You DB block size is 4096 bytes, so multiply the value you set here by 4096 to calculate the memory usage.
Unfortunately if the executables are 32 bit you won't be able to address more than around 2GB of memory so you will be limited quite heavily what you can increase this to.
If it is 32 bit you maximum number of buffer blocks (-B) is limited to somewhere around the 300,000 area. I generally use 250,000 on 32 bit servers.
If 64 bit you can go up much higher (I have one database on 2000,000).
This will likely help if the disk access is the bottle neck. Make sure you don't consume all the RAM.
Joins are not the strongest point in Progress (you want to upgrade to the coming v12 for that) and mfg/pro has lots of it.
Second: your -B seems low for the database. If I am correct, your db is about 19GB in size and you have ~ 400MB of cache memory. Use as much -B as your progress license and machine allow. I have seen configurations up to 200GB of -B
mitreddep,
Since no one mentioned it yet, I would also want to investigate whether there are proper indexes for the queries that are slow. A query that searches on a set of fields that don't have appropriate indexes will be forced to use the default index or do a whole table scan, which depending on the table size could significantly reduce your performance. I know your question was more specifically about hardware, but I wanted to point out that indexes can contribute to performance. Not sure if your external support team will be able to look into the indexes for you.
If the whole application is equally slow for large queries on different tables, that would lead me toward hardware and network parameter tuning as others are suggesting.
Tim
Thanks for all the replies on this. The database size is 18GB and it is definitely 64bit. I have experimented with a range of -B values from 100 000 to 3 500 000 and my test takes the same time no matter what the settings are. I monitor network, disk, CPU and RAM throughout the test and nothing maxes out on either the server or the client during the test, which seems odd to me. If I copy a large file from the server to the client the network and disk usage goes far higher than when I run my test.
We do have indexes set but even with these I would still expect my test to use all of the available resources, it is as though something is limiting what it can use, but I can't see what.
Thanks
As stated before, the 2 biggest limiting factors you have are your Progress version, and the Workgroup license. -B is the cache. It won't make a bit of difference for things other than the disk reads as cached records are read from memory rather than disk. You definitely should set it as high as you can. If the server isn't overloaded with 3,500,000 then leave it at that - the users will be appreciative in the long run.
In your position, if there is money to spend then you need to look at removing the next obvious limiting factors as just mentioned. I completely understand Progress version being out of your hands. Been there before, but upgrading to Enterprise would definitely be possible as it makes no difference to the application. This will enable you to tune a number of switches under the bonnet.
mitreddep,
Can you post the result of the following code?
DEFINE VARIABLE vTime1 AS INTEGER NO-UNDO.
DEFINE VARIABLE vTime2 AS INTEGER NO-UNDO.

ASSIGN vTime1 = MTIME.
FOR EACH DICTDB._Index-Field NO-LOCK,
   FIRST DICTDB._Index OF DICTDB._Index NO-LOCK:
END.
ASSIGN vTime1 = MTIME -  vTime1.

ASSIGN vTime2 = MTIME.
FOR EACH DICTDB._Index NO-LOCK:
  ACCUMULATE "_Index" (COUNT).
END.
FOR EACH DICTDB._Index-Field NO-LOCK:
  ACCUMULATE "_Index-Field" (COUNT).
END.
ASSIGN vTime2 = MTIME -  vTime2.

MESSAGE
  "Time1:" vTime1 / 1000 SKIP
  "Time2:" vTime2 / 1000 SKIP
  "Count1:" ACCUM COUNT "_Index" SKIP
  "Count2:" ACCUM COUNT "_Index-Field"
VIEW-AS ALERT-BOX.
> FIRST DICTDB._Index OF DICTDB._Index NO-LOCK
Should that be FIRST DICTDB._Index OF DICTDB._Index-Field NO-LOCK?
> Should that be FIRST DICTDB._Index OF DICTDB._Index-Field NO-LOCK?
Correct. But in fact it does not matter - it's still a join. ;-)
You say that you select a large number of records within the app, have you tried to perform record selection through a Progress Editor session instead? The application could be doing anything with the data during the retrieval that could give the impression that the selection is slow. Cut out the application and talk directly to the database and see if you get the throughput that you expect.