
Hello, I can contact you to have a little assistance.
For years we have been developing Progress software (from V8 to today).And for a few years we have always configured the OpenEdge Explorer in the same way and for all our customers (since the release of the V10). But some of our customers are beginning to have serious basics and worries, which I begin to attribute to a bad configuration (or non optimization) of the OE Explorer.
We are encountering more and more (on Windows 7/8/10) white screens that freeze or disconnections at the base. I have copied an example of basic conf with the conmgr for a client that has 50 users connected to the database (the base that makes 13GO).
[View:/cfs-file/__key/communityserver-discussions-components-files/26/conmgr.properties:320:240][View:/cfs-file/__key/communityserver-discussions-components-files/26/CONF-OE-EXPLO-10.2B.pdf:320:240]Thank you by before your feedback :)
I assume this is 10.2B -
I see that you're allocating more than the 2GB limit for 32-bit OS (400000 * 8) and the shared memory segment size is 128MB, which would imply that you're using 32-bit OpenEdge? The /3GB, /PAE and /AWE switches needed to accomplish this have never been a good idea.
Then again, with a 13 GB database and 50 users, you should probably look at using the 64-bit version.
You could consider;
Raising the Max Servers and Number of Servers ( 5 > 10)
Lowering the Maximum clients per server ( 10 > 5)
Increasing your bibufs
Are the 13 GB all part of the working datasets, or is it time to archive data out?
When last was this database dumped and loaded or at least integrity checked and indexes rebuilt?
Are you using Type II Storage Areas - you should be.
Are there still application tables/indexes in the Schema Area - there really should no longer be.
screens that freeze or clients disconnecting their in-process sessions would need more explicit investigation, starting with the application code that they're running at the time and what trouble they're getting into when doing so. Ideally reproducible scenarios can make use of clientlogging to get a better picture
Hi and thank pour your answer,
- Yes this db is in 10.2B07.
- Yes i'm reading some technical documentation for Progress and i see the limite of the version 32bits (developers do not seem to be prone to switch to 64Bits).
- For the Shared Memory what do you recommend ?
- Yes at the moment we still use the 32Bits version. After 2 weeks of training with a person from Progress, it seems that the idea of past in 64Bits begins to come.
- PAE / AWE ? i don't understand...
- Ok for up max serv et down max user per serv (i will try tomorow)
- How can i increase my buffer of bi ?
- If i run database in OE 64Bits on my server, can i run client application in 32Bits ?
- unfortunately yes the 13GB are only the current 5 years of the customer
- do a dump/load and idxbuild is one of the solutions that I thought to put in place
- the devs do not know what a type 2. one of them tells me that they create the base in Empty 4 (if that's the question ...)
- Not at the moment everything is in the same place. But they know that it is not optimum ... but they think about it ....
- for the crash we try to see with this in the launch line of the application (-clientlog gpi_crash.lg -logappend 0 -logentrytypes 4GLMessages: 3,4GLTrace: 3,4GLTrans: 3 -logginglevel 4)
Thank you again for your help
Yes a 32 bit client can connect to a 64bit DB server.
As far as Type I/Type II, post the content of your db.st file and we can tell you whether it is one or the other.
If the database was created from Empty4, then I would advise as part of the dump and load process to move to 8k block size (empty8).
By the way, you don't have to solve all this yourself. There are consultants out there who can help. Progress do consultancy and I can recommend a non-Progress consultancy also if you want. Send me a message.
Hello James,
Here is the .st file
b .\ f 640000
b .\
#
d .\ f 640000
d .\ f 640000
d .\ f 640000
d .\ f 640000
d .\ f 640000
d .\ f 640000
d .\ f 640000
d .\ f 640000
d .\ f 640000
d .\ f 640000
d .\ f 640000
d .\ f 640000
d .\ f 640000
d .\ f 640000
d .\ f 640000
d .\ f 640000
d .\ f 640000
d .\ f 640000
d .\ f 640000
d .\ f 640000
d .\
#
It would be a good idea to run 'prostrct list' on the db from a proenv session, but yes that's Type I storage. And it looks like everything's in the schema area too.
Hello,
This is the result of the prostrct list db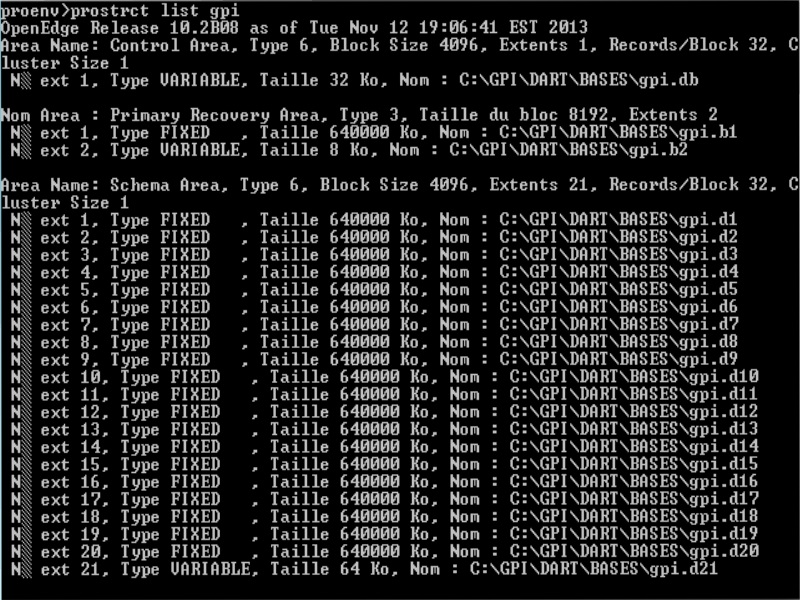
Thanks for that - the db.st will now have more usable information in it also, but yes, to confirm all your data is in the schema area, which by definition has to be a Type I storage area. You will see large benefits (usually) from a dump and reload to type 2 storage, with all data in one storage area and all indexes in another storage area (as a bare minimum).
Again, this may be something you may wish to seek assistance with as it's not a trivial change if you don't know what you're doing.
You are also not running after imaging on this database which means if you have a problem and need to revert to backup you will lose everything up to the point of the backup. It would be a good idea to look at implementing after imaging if you care about the data :)
Thank you very much for your reply.
I will be able to present your proposal to my development department.
On the other hand I looked to optimize my configuration OE Explorer ... and I confess that I get lost a little.
documentation.progress.com/.../index.html
I have done several tests by changing parameters, but it is very hazardous for me ...
[View:/cfs-file/__key/communityserver-discussions-components-files/26/New-param-OE.pdf:320:240]
> I have done several tests by changing parameters
It's not a good idea to play blindly with startup parameters. Can you post the basic Activity screens in promon?
Hello,
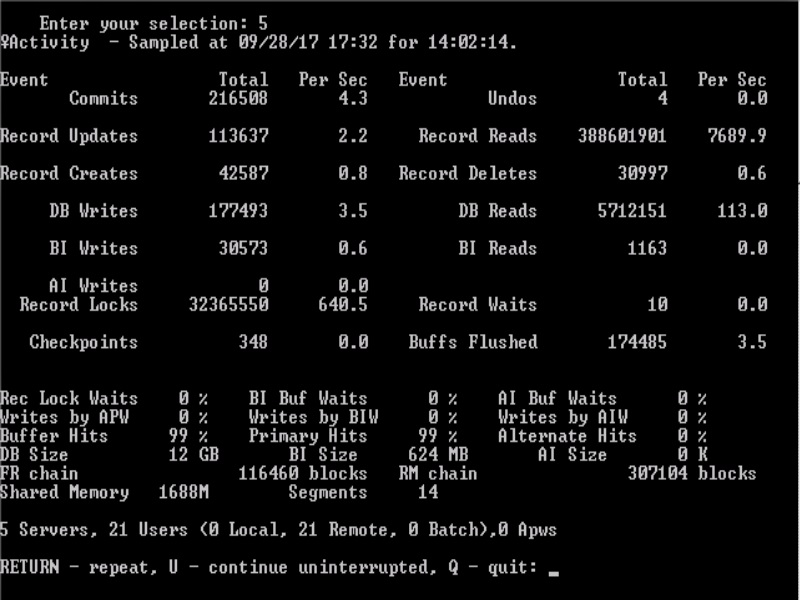
Here is the screen of the Promon
Hello George,
Yes I know it's not a good idea, but I do it on a test server, not a production server :)
> Here is the screen of the Promon
14 hours is a too long interval for the sampling. 10 sec - 5 min interval at the most busy time would be better.
Thk for your answer George,
I understand what you say, byt i don't see in OE where i can change the sampling time...
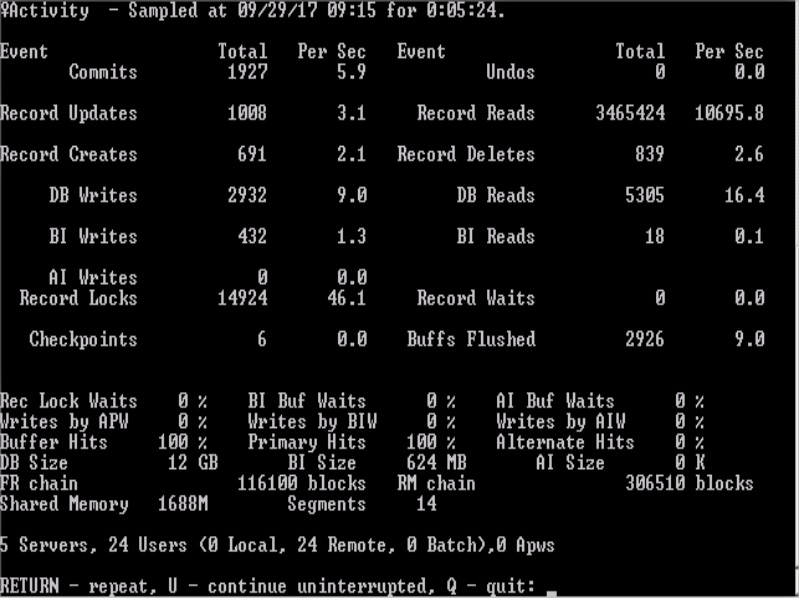
Load the screen as you did above, then wait 5 minutes and hit return. This refreshes the data and displays everything since the last sample.
Here the new Promon.
But i think it's not realy representative at this time (no more users connected)

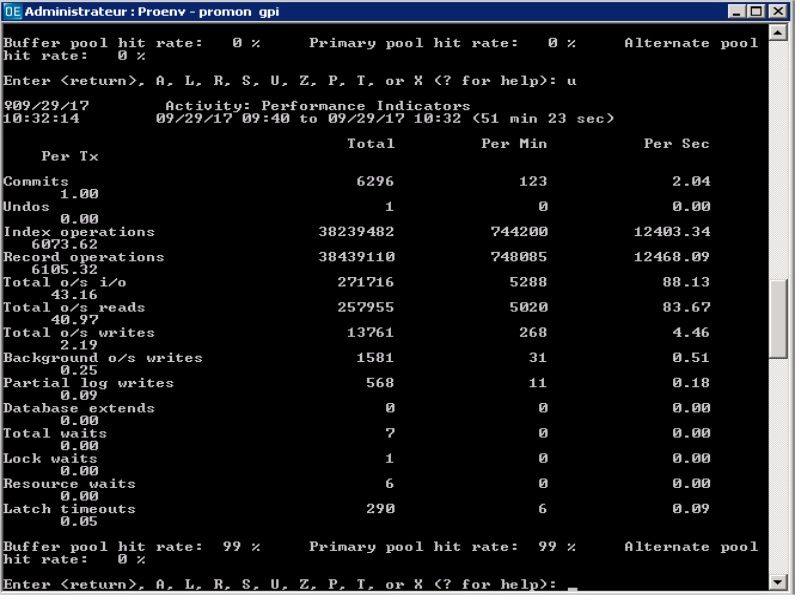
At right time check also "Activity: Performance Indicators" screen:
promon/R&D/3/1
Are you using vanilla 10.2B or at least SP07?
Hello George
Thank you for your answer. Here are the required screens
 ,
,
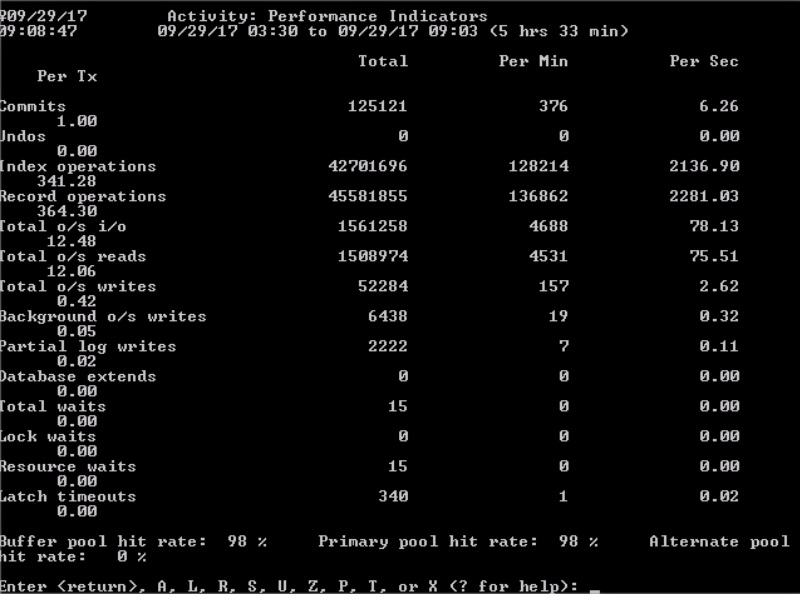
Promon screens indicate that there are no performance issues inside database. Did the end-users already complain about performance at 9 o'clock at morning?
BTW, on R&D level in promon you can zero statistics (press "Z"), wait a bit and then update statistics (press "U"). This way you will get statistics for short interval almost on all Activity screens including "Activity: Summary" - you will not need to wait on each screen. "Activity: Summary" on R&D level can replace the similar screen you posted.
Hello George,
Here si the new screen
This morning I have not had any feedback from users for concerns of slow or freez
Statistics looks good.