
Hi, recently we change our databases to a new server but the startup and the queries are extremely slow, even tho the hardware is better than before.
We lack knowledge about databases, we manage our clients services and remote connection as well as other services but we do not know about databases, we cannot diagnose and fix the performance issues, so we thought you guys could help us.
The virtual machine specifications are:
Windows 2012 x64, Xeon E5-2620 v3 2,40Ghz, two processors, and 17Gb Ram.
We currently use OpenEdge 11.1 x32
This are the startup log of the DB:
BROKER 0: (333) Login multi-user.
BROKER 0: (15321) Log Initialization Before Image in block 758, offset 964.
BROKER 0: (452) The SYSTEM user logs in batch.
BROKER 0: (5644) to 2509 using TCP Arrancado IPV4 address 0.0.0.0, pid 364.
BROKER 0: (8836) Connecting to the Admin Server on port 7842.
BROKER 0: (14262) Successfully connected to AdminServer on port 7842 using TCP / IP IPV4 address 192,168,150,254.
BROKER 0: (8846) Registered with the Admin Server.
BROKER 0: (4234) Release Progress OpenEdge 11.1 build 1143 in WINNT.
BROKER 0: (4281) initiated by SYSTEM on Server batch.
BROKER 0: (6574) Booted using pid: 364.
BROKER 0: (4235) Physical name of the database (-db): C: \ SYNERGY \ Active \ BDCemevisa \ ver2000.
BROKER 0: (4236) Database type (-dt): PROGRESS.
BROKER 0: (4237) Forced access (-F): Not Enabled.
BROKER 0: (4238) Direct I / S (-directio): Not Enabled.
BROKER 0: (-----) enabled LRU mechanism.
BROKER 0: (-----) Number of LRU force skips (-lruskips): 0
BROKER 0: (-----) Number of LRU2 force skips (-lru2skips): 0
BROKER 0: (4239) Number of Buffers Database (-B): 390000.
BROKER 0: (-----) Number of Alternate Database Buffers (-B2): 0.
BROKER 0: (9422) Max number of private buffers by to list it (-Bpmax): 256.
BROKER 0: (4240) has exceeded the size of shared memory (-Mxs): 100.
BROKER 0: (10013) The shared memory segment is locked into memory.
BROKER 0: (4241) Current size of the lock table (L): 819200.
BROKER 0: (13953) Number of maximum area (-maxArea): 32000.
BROKER 0: (4242) Table Entries Hash (-hash): 32.
BROKER 0: (4243) Current attempts Spin Locks (-spin): 80000.
BROKER 0: (6526) Number semaphore set (-semsets) 3.
BROKER 0: (13924) Maximum size of shared memory segment (-shmsegsize) 4096 Mb.
BROKER 0: (4244) Crash Recovery (-i): Enabled.
BROKER 0: (6573) Database Blocksize (-blocksize): 4,096.
BROKER 0: (4245) Delayed flow-Picture Previous (-mf): 2.
BROKER 0: (4247) E / S in file-Picture Previous (-r -R): Reliable.
BROKER 0: (4249) truncation Range Image-anteror (-G): 0.
BROKER 0: (4250) Cluster size Image-Previous: 524288.
BROKER 0: (4251) Block Size Image-Previous: 8192.
BROKER 0: (4252) Number of buffers IMAGE-Previous (-bibufs): 90.
BROKER 0: (-----) Record free chain search depth factor of 5 (-recspacesearchdepth)
BROKER 0: (9238) File Size Threshold of BI (-bithold): 999.5 MBytes.
[BROKER 0: (6551) File Stall Threshold BI (-bistall): Enabled.
BROKER 0: (4254) Since IMAGE-Posterior (-aistall): Enabled.
BROKER 0: (4255) Block Size Image-Posterior: 8192.
BROKER 0: (4256) Number of buffers IMAGE-Posterior (-aibufs): 40.
ROKER 0: (-----) Partition Manager cache size (-mtpmsize): 1024
BROKER 0: (8527) cache size storage object (-omsize): 8192
BROKER 0: (4257) Maximum number of clients per server (Ma): 2.
BROKER 0: (4258) Maximum number of servers (-Mn): 26.
BROKER 0: (4259) Minimum number of clients per server (My): 1.
BROKER 0: (-----) Server network message wait time (-Nmsgwait): 2
BROKER 0: (-----) Delay first prefetch message (-prefetchDelay): Disabled
BROKER 0: (-----) Prefetch message fill percentage (-prefetchFactor): 0
BROKER 0: (-----) Minimum records in prefetch msg (-prefetchNumRecs): 16
BROKER 0: (-----) Suspension poll queue priority (-prefetchPriority): 0
BROKER 0: (4260) Maximum number of users (n): 61.
BROKER 0: (4261) Host Name (H): bData.
BROKER 0: (4262) Name Service (-S): 2509.
BROKER 0: (14268) version of TCP / IP (-ipver): IPV4
BROKER 0: (4263) Network type (N): TCP.
BROKER 0: (4264) Character Set (-cpinternal): ISO8859-1.
BROKER 0: (4282) Parameter File: Not Enabled.
BROKER 0: (5647) Limit broker servers (-Mpb): 23.
BROKER 0: (5648) Minimum Port for Auto Servers (-minport): 3000.
BROKER 0: (5649) Maximum Port for Auto Servers (-maxport): 5000.
BROKER 0: (8863) This broker only supports groups 4GL servers.
BROKER 0: (9336) Created with the shared memory segment id: 43057152
BROKER 0: (12813) allowed Cursors index (c): 244.
BROKER 0: (12814) Group Delay (-groupdelay): 10.
BROKER 0: (12815) Block hash table, table size (-lkhash): 137,743
BROKER 0: (12816) Maxport (-maxport): 5000
BROKER 0: (12817) Minport (-minport): 3000
BROKER 0: (12818) Message Buffer Size (Mm): 32600
BROKER 0: (12820) Servers highs Broker (-Mpb): 23
BROKER 0: (12821) Use muxlatches (-mux): 1
BROKER 0: (12823) Traffic lights (-semsets): 3
BROKER 0: (13870) Database Service Manager - Queue Size IPC (-pica): 8.0 MBytes.
BROKER 0: (13896) Limit jump TXE lock Commit (-TXESkipLimit): 10000.
BROKER 0: (15219) encryption is enabled: 0
BROKER 0: (15218) cache size encryption (-ecsize): 1000
BROKER 0: (15824) Multi-tenancy enabled: 0
BROKER 0: (10471) Database Have Been enabled connections.
SRV 1: (452) The SYSTEM user logs in batch.
BROKER 1: (5644) 2500 Arrancado using TCP IPV4 address 0.0.0.0, pid 3272.
BROKER 1: (5645) This is an additional broker for this protocol.
BROKER 1: (8864) This broker only supports SQL server groups.
SRV 2: (452) The user logs on SYSTEM WITH :.
SRV 2: (5646) Booted in IPV4 TCP port 3001 using address 0.0.0.0, pid
SRV 2: (742) connecting the user number 85, userid client manager type ABL, in bData using TCP / IP IPV4 address 192,168,150,254.
SRV 2: (7129) 85 Usr set to administrator name.
We also had a shared memory overflow-size issue, as shown in the startup log. Yet we do not fully understand the problem, since it has been set to 1024 and we still have that problem.
Also, we have around 60 clients, which values should B1 and B2 be at?
Right now, the database queries takes the entire CPU % usage, which is not normal.
I really appreciate your help guys.
Hello!
Finally I solved the problem by reducing the parameter -hash of 32-0 (I put in 32, because someone recommended it to me).
The database now works very well.
Now I'm trying to improve performance by changing parameters pf.
Thank you all for your comments!!
Check the VMWare NIC: E1000 or vmxnet3 ? It should be vmxnet3.
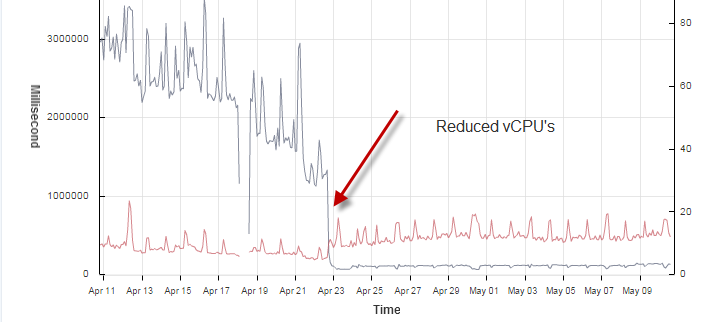
You could also be paying the penalty of over sizing your VM by allocating too many vCPUs.
When this is done the vm spend more time in trying to get a CPU ready state than actually using the processor. This will show up on the VM as the processor going to 100% but on the VM host low CPU utilization. What is happening is that the VM host scheduler is spending time getting the provisioned number of CPUs available for the the VM to use.
You can see this in the advance section of the Performance graph for CPU in vCenter for the VM.
By selecting only the Ready and Usage counters and only selecting the server target (not all the CPU objects)
If the the Ready counter is higher than the Usage counter (most of the time or when under load) then you have a problem. If the Ready counter is > 400 milliseconds will probably have an issue.
This graph show an example where I had 4 vCPU provisioned and then reduced it 1. Notice how the counters are now inverted. After the change the VM ran much better and the CPU only occasionally went to 100%
This blog has good info on this- especially if you dig into some of the comments/replies:
http://www.joshodgers.com/2012/07/22/common-mistake-using-cpu-reservations-to-solve-cpu-ready/
Our version is VMware ESXi, 5.5.0, 2068190 - so maybe we need to do an update since it is a Dot Oh No release. :-0
We use ESX 5.1, but the CPU issues have been fixed already.
We do use vmxnet3.
We are currently checking out the overflow size parameter.
What about the B1 and B2 parameter? Could that affect the performance of the DB? The queries do not use that much RAM, 3Gb. Is it possible to increase the memory usage in order to speed up the processes?
Ok Brian, I'll try to change it tomorrow afternoon.
Thanks.
We did as you suggested and indeed it improved the performance. Yet, our database still very slow.
The writes by APW are always at 99-100%, is that normal?
In addition, throughout the day the database becomes more and more slowly and we do not know why.
Any more advices? We really need help here.
Thanks.
grupoci, some sugestions:
- I think the -spin parameter is too big. Try to start it with 10000 at most. This parameter may cause de 100% cpu using if it is set to a number bigger then processor capacity.
- Is your Progress 32 bits? If so, you may get some issues with the value passed to -B. Try to reduce it to 100000 and monitor with promon to adjust a better value if needed.
- The writes by apw are 100% is good. It means that APW is working. You can also check if there is any buffers flushed at checkpoint or how many checkpoint the database is doing per hour. If it is to many, maybe the database is freezing during this process.
Also, it seems the server is a virtual machine. Consider to check for performance issues on the main server.
Adriano.
Hello!
Finally I solved the problem by reducing the parameter -hash of 32-0 (I put in 32, because someone recommended it to me).
The database now works very well.
Now I'm trying to improve performance by changing parameters pf.
Thank you all for your comments!!
> BROKER 0: (4239) Number of Buffers Database (-B): 390000.
> BROKER 0: (4242) Table Entries Hash (-hash): 32.
Just can't believe it!
KB-18889: -hash How it affects performance. How it should be set. (written by GHB)
The default value for -hash is chosen to be a prime number approximately equal to one fourth of the number of database buffers (specified with the -B startup parameter). The exact size of the hash table is not important (see below), but its size should be a prime number because that will produce the most even distribution of buffer headers across hash chains.
> Finally I solved the problem by reducing the parameter -hash of 32-0
The -hash parameter requires an argument greater than 0. (1404)