
The profiler in PDSOE is helpful to determine where CPU is being consumed when programs are running. But it doesn't differentiate between the intended work of the program, and the overhead that is due to interpreting the R-code. Are there any performance "counters" that expose the activities of the R-code interpreter itself?
I have some programs that are taking several seconds to execute, even after the data has been pulled entirely into TT's in memory on a 4 GHz machine with plenty of RAM. I have a high -mmax -Bt and -tmpbsize. I've already ruled out the possibility that the program is using disk or database, or network. The only resource that seems to be the bottleneck is CPU. I can use the PDSOE profiler to isolate various programs that are consuming the most time and then try to find problems or optimize them individually.
However, when I'm working with these programs there doesn't seem to be any way to distinguish the portion of the CPU that is being consumed by the interpreter. I've used -y and -yx but these don't get to the level of details that I'm hoping for. Ideally there would be windows-style performance counters that track the interpreter itself.
Another thing I'm considering is potentially using the VS profiler. I think it has the ability to attach to native applications on windows and do sampling. Has anyone ever tried attaching this to an AVM process?
David, I'm not sure I understand exactly what you're looking for. When profiling is enabled, the AVM records a start time and an end time for every ABL statement. The AVM overhead time for a module (procedure, class, function, method, trigger block).
The overhead is comprised of three things:
1) Time to instantiate the module; this may include time to read the r-code from the disk, initialize variables, check schema cache, allocate buffers, temp-tables, etc.;
2) Time to exit the module; clean up of the above allocated items.
3) Time to do any garbage collection which happens to have taken place while in the module.
The overhead time is assigned to "Line 0" of the module.
Garbage collection typically takes place in between execution of lines of code. In 12.1, we broke out the time spent doing garbage collection and assigned that time to "Line -2" of the module.
Meant to write: "The AVM overhead time for a module... is comprised of three things:"
At a very high level I'm interested in knowing what percentage of time is spent interpreting r-code vs actually doing the intended work. IE. assuming that it was possible for the ABL code to be jitted into native instructions, I'd like to know how much faster would that run than the interpreted R-code.
It might help to have a concrete example. Below is a method FillInventoryLocationForProductType. It calls an interface method : IF NOT p_RelevantInventory:CheckPredicate(...). It calls the method 24000 times. ...
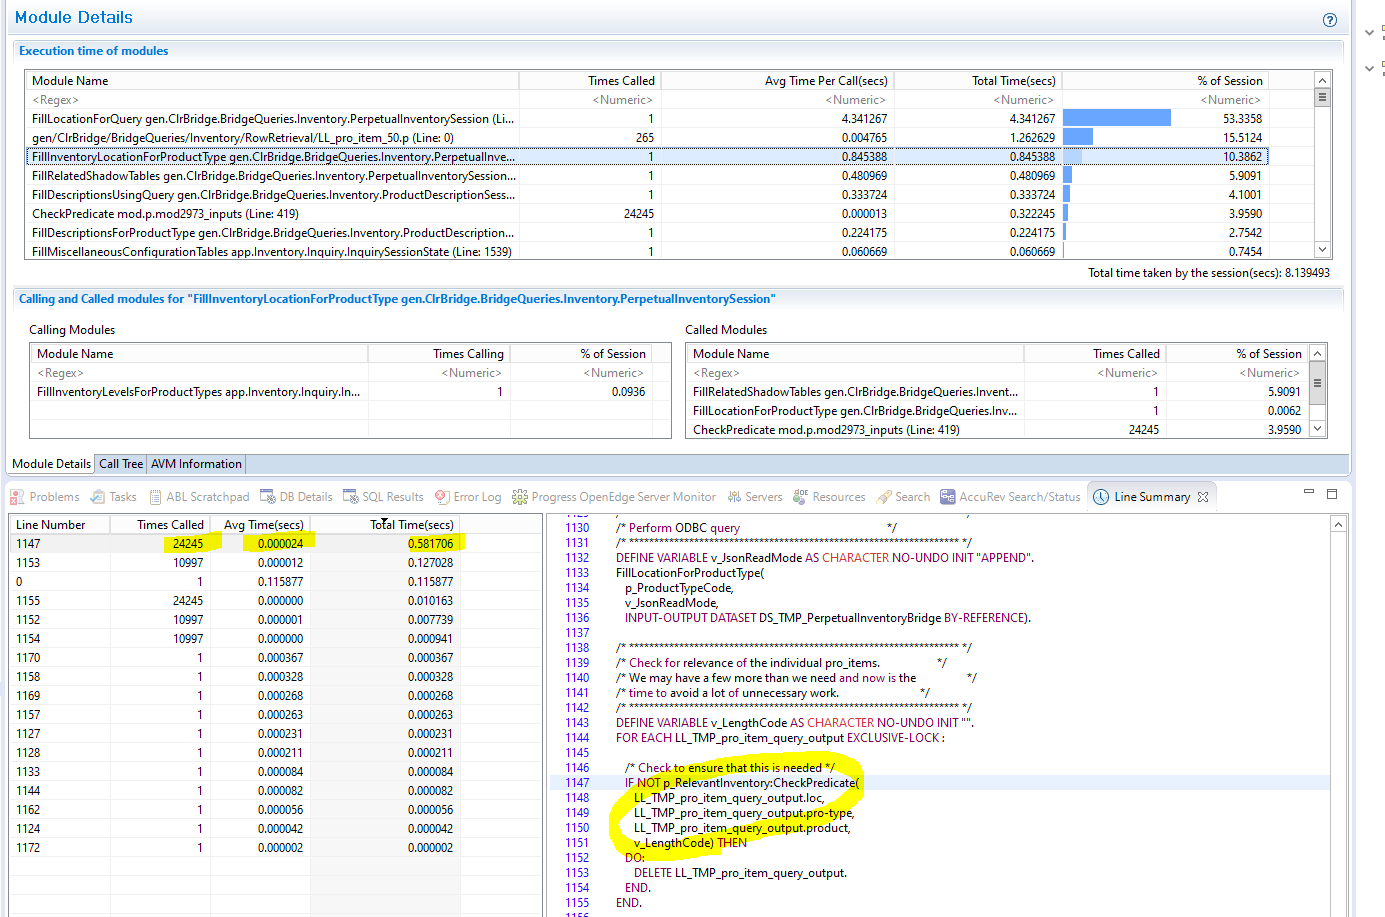
The total elapsed time of invoking CheckPredicate appears to be ~600 ms. This is an interface method.
Below is the actual implementation of that CheckPredicate (implemented by "mod2973_inputs"). The total elapsed time of the body of the implementation is ~300 ms. (that is the total for *all* of the 24000 iterations).
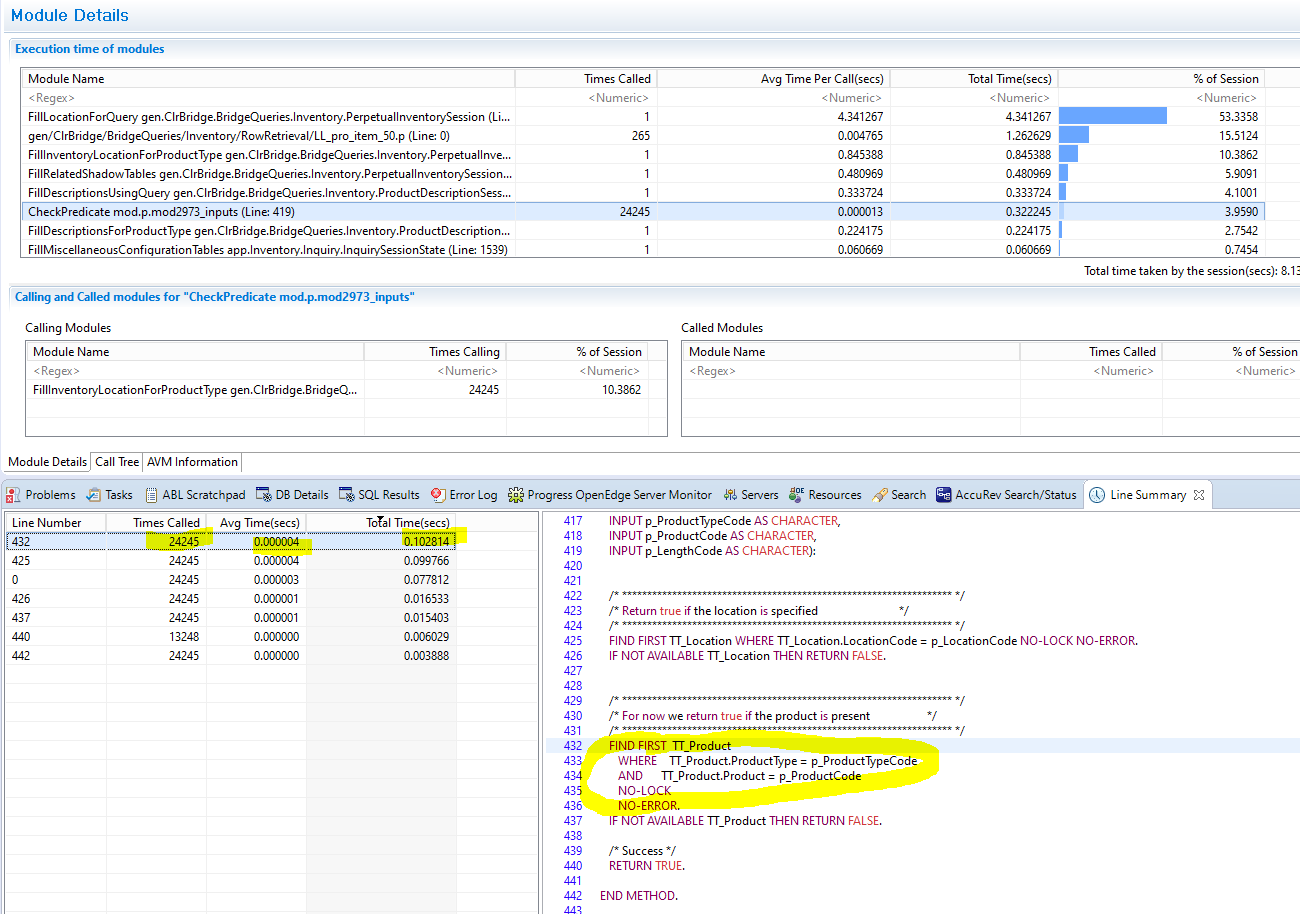
The combination of both parts above takes about one second. The invocation of the interface method and the implementation of that method are entirely CPU-bound. The only work we are actually doing is to access temp tables with FIND statements. But in the process, we consume a total of about one second for all the 24000 iterations of the loop.
Given that we are CPU-bound, I'm trying to understand if there is a way to refactor the code to make an improvement. But before I can start refactoring I need to understand how the CPU time was actually spent (~4 billion clock cycles of time). I would imagine that there is a significant portion which involves interpreting r-code. Perhaps if we could drill down to the r-code instructions or even get a measurement of the number of underlying instructions, then that might be used as a baseline for comparisons. Then I would simply refactor my ABL in a way that decreases the number of overall instructions which need to be interpreted.
I might be going down an unnecessary rabbit hole here by asking for interpreter metrics.... The most glaring problem is simply that 24000 iterations of an interface invocation take ~582 ms. It seems clear that there is a performance problem with interface invocations in OOABL. At the same time, it would be helpful to have the low-level metrics that could be used to prove the point. It seems like the AVM interpreter itself should have some metrics which could be made available to us for profiling purposes.
> On Oct 28, 2019, at 3:36 PM, dbeavon wrote:
>
> I might be going down an unnecessary rabbit hole here
you are.
when you run your application, it has the 4GL overhead as part of it. you cannot eliminate that. furthermore, the overhead added to your app by the 4GL is not just simple interpretation of r-code. it also has a lot of functionality in addition to the interpretation. but i digress. while (highly) interesting, not useful to app developers.
when you measure the application performance, you should consider it in toto. the profiler tells you where the time goes with pretty good accuracy (though there are some things that are confusing and could be improved). it takes time to understand the implications of the data you get and what you can do to make improvements. the most effective improvements often are changing the algorithms used by your application’s code rather than micro-optimizations at the statement level (though those can be useful at times). to put it another way, many performance problems are caused by sh*t code.
a long time back, i wrote a test harness that to measure the 4GL overhead. its purpose was to test performance improvements made to the 4GL runtime and to compare releases. i cannot share that with you since psc owns it.
I was able to change the performance of this invocation by refactoring the code.... Instead of calling an interface method, I started calling an internal method on a persistent procedure handle.
The performance difference in the invocation was only an improvement of about ~200 ms for 24000 iterations. Whatever performance I was gaining in one place was lost in another. I eventually abandoned the effort.
My primary complaint is that the profiler in ABL only gets down to the *statement* level, and this may not be granular enough. Your program can still waste 100's of milliseconds on a moderate-sized dataset without any really good explanation. We don't seem to have the metrics that we would need in order to figure out why the method invocations are slow.
The method invocations seem slow to me since they consume ~600 ms for 24000 iterations . A similar test in C# was about 100 times faster. The conclusion is that ABL programmers should avoid methods. IE. we can write faster code by avoiding the use of smaller methods (especially in a loop with lots of iterations). The cost of the method can exceed the "real" work done within it. Perhaps the avoidance of methods could be accomplished if we go back to all the include files that we used back in the good ol' days.
I'm assuming that the overhead is interpreter-related but, as you say, there is no way to know for certain. It could be related to functionality differences since C# passes strings by reference and perhaps ABL copies data around in memory before calling the method. Or there could be some other mysterious performance cost that is hidden deep within that statement.
In your screenshot i see an do...end block with one statement. Do...end can be removed
Change find first... if available To can-find
Should save you Some ms per run
>> Change find first... if available To can-find
Thanks for that tip. A few more tips like this and performance overhead will be even more unbalanced than it is now (eg. there will be an even higher proportion of time spent on the invocation of the method than on the actual work that is contained within the body of the method).
A similar test in C# was about 100 times faster.
Some things in ABL are always going to be slower than C, a LOT slower. Try a test on string operations. This is the nature of the beast. On the other hand, these are typically things which take very little real world time and there is usually a limit to how many times in a row one is going to do them. I.e., a loop of 100,000 string operations is only meaningful if one actually has an application need for doing just that. Most of the time it is just an artificially constructed test. When it is real, possibly one needs to rethink the solution. On the other hand, there are some operations in ABL which are unusually performant. E.g., anything dealing with the database is typically very rich in functionality compared to what one would write in C and performs very well.
I was comparing to c#.net which is also a "managed" runtime (CLR) and is somewhat analogous to the AVM.
As I understand, the primary difference is that c# is typically jitted into native instructions at some point along the way. So that prevents the same statement from being re-interpreted repeatedly. My original question assumed that the re-interpretation of the same r-code in a loop was the overhead that is primarily responsible for the performance difference between the CLR and the AVM.
But as Gus points out, the interpretation of the method invocation cannot be the *only* thing that accounts for the performance difference. There is almost certainly a lot of functionality that is different, in addition to the interpretation of the r-code. However the PDSOE profiler doesn't allow us to know what is actually happening for those ~600 ms. Most programmers (ABL or otherwise) who are writing code would not account for the overhead cost of the method invocation itself, since we assume it is essentially free. But that doesn't seem to be the case here.