
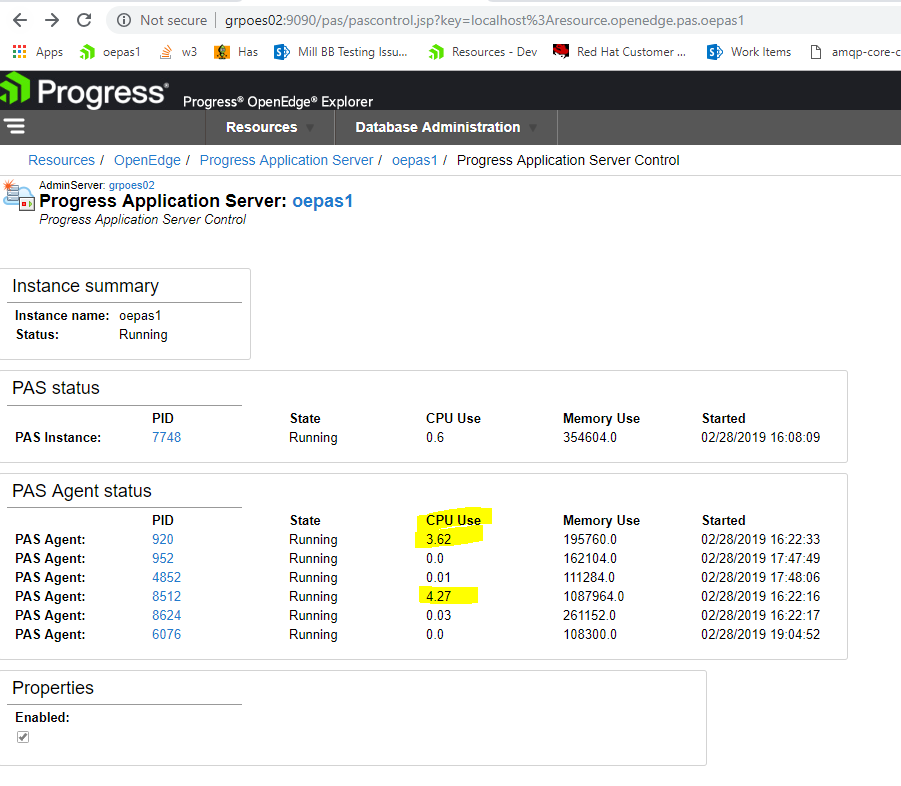
The instance control screen in PASOE says that I'm using about 8% cpu on two agent processes.
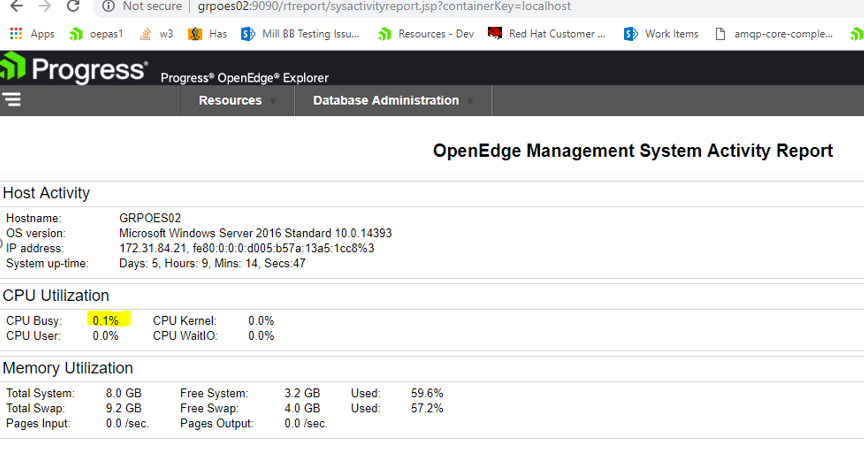
See below. This is way wrong. The numbers change, but they seem to be calculated incorrectly. Another screen, the adminserver system activity screen is shown beneath that. It shows the more realistic CPU activity that is basically 0%. (And I can confirm the 0% number using perfmon counters on windows.)
So why does instance control show such high CPU usage when there is basically none!? Maybe the calculation was works better in Linux? Or it is a maximum cpu that was detected over a large window of time?
The admin server system activity is shown below.
The data comes from the windows wmic command line tool. It is calculated as KernelModeTime + UserModeTime * 100 / "elapsed time of process"). This is a calculation that is in place for any any process, including classic appserver agents. Elapsed time of process is "now" - "CreationDate". This is what I could gather in a few minutes of reading code. I think this was done because other operating systems like linux generate timing data in "jiffies" which is scheduling timing, rather than raw milliseconds. OS's don't really give "current % used". Rather the data is exposed to calculate it yourself. I don't know why this choice was made many many years ago. If I understand this correctly, KernelModeTime and UserModeTime is cumulative over the life of the process. It is not a % of "now".
The WMIC query is more or less like this:
>wmic Process where Processid=#### get CommandLine,CreationDate,ExecutablePath,KernelModeTime,MinimumWorkingSetSize,ParentProcessId,Processid,UserModeTime,WorkingSetsize
Whereas the "CPU Utilization" on the second screenshot is a more fine grained value. It also comes from wmic using this query which is Windows reported current average for the last 1 second. This comes from windows perf counter data. It is "cooked" data which basically means wmic takes 2 samples for the Processor and User time with a 1 second delay, and subtracts them and divides by the time difference, basically the same as the per PID metric, but only calculated over 1 second, rather than the elapsed time.
>wmic path Win32_PerfformattedData_PerfOS_Processor get PercentInterruptTime,PercentPrivilegedTime,PercentProcessorTime,PercentUserTime
I agree the data isn't in the best format, and is too coarse. Rather the per process CPU usage should be using the same double sample and short interval, rather than single sample since beginning of process which would give a much clearer "now" value.
the instantaneous (i.e. over a 1 sec interval) cpu usage is mostly worthless since cpu usage varies quite a lot for most processes.
The problem in the OEE console is mostly related to the internal inconsistency. The 8% CPU usage that is shown in the list of agents doesn't align with 0.1% CPU that is shown in the the admin server's "system activity" report. They can't both be correct.
The cpu shown in the list of agents is normally overstated, based on my experience with it. It isn't that helpful, or perhaps it is only helpful insofar as seeing the relative CPU consumed by one agent or another (for comparison purposes).
Where CPU is concerned, the windows perfmon counters are probably the best way to get accurate information about the health of the PASOE server.
They are both correct for what they are trying to show. One is average over a small piece of time, the other is an average over a much longer period. They will never align.
You are both right. This is why windows gives a chart updated every 1 second for windows task manager. unix top is similar and updates frequently to give a more accurate picture of what is going on. Inferring usage over a longer period of time from a one time snapshot doesn't give the bigger picture, nor taking an average over several minutes isn't realistic either for what is going on "now" or "recently".
A chart updated frequently gives a better picture. The source of the data and how it is calculated is the same: averages over 1 second plotted every second (or there about). Having live charts for some of this stuff would be more useful than static snapshots.
Both queries are using windows performance counters via wmic. There is no other source of the data. There more direct ways to get the data than going through wmic, but the origin is the same.
matt, you aright. and no one should care about 1 sec cpu usage.
but: WHAT is the problem that needs to be solved?