
Hi to all!
Good morning to all guy!
I'm a new italian user of OpenEdge SW suite, so sorry for my bad english.
I come from C, PHP and SQL languages and now i start to work with OE.
I made an exercise into i calculate the Fibonacci value.
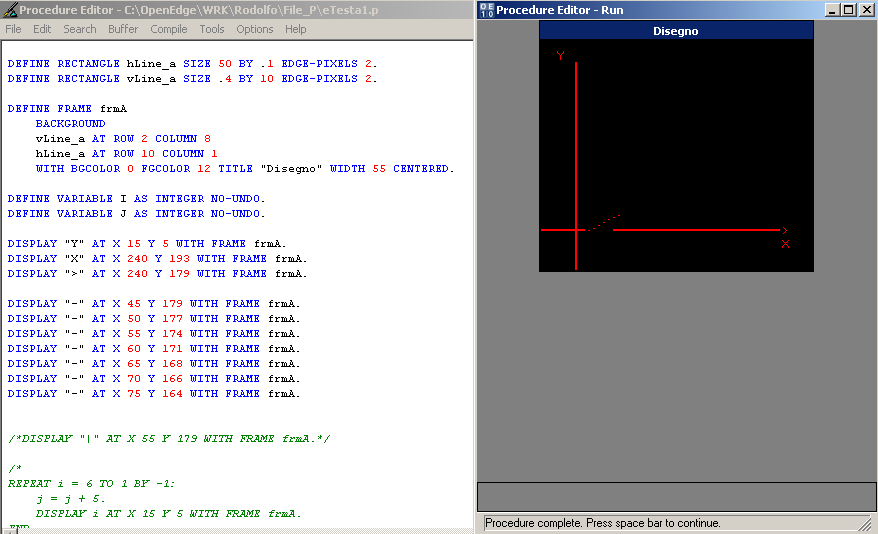
The second idea that incoming in my head was "Why don't made a graphic rapresentation of the y=f(x) function"?
I try in the mode explain in picture.
http://img398.imageshack.us/img398/9960/drawwithabldz1.png
Someone can indicate the mode to do this second idea?
TNX!
I have think to display pxl to the place of character. Is this the "Master Road"?
You could write the values to a file and run an external tool to convert that into a BMP graph, and then display that BMP file within your OE window. This can be done via an OCX (see 'SalesGraph' sample code within your DLC directory), a call to MSExcel graph, or any number of small applications like 'fly' () which can take a file of data and plot values.
TNX.
In Win32 i put the fly.exe in System32 directory.
How i call (shell/prompt mode) this external program?
Not sure what version you are running so went v9 with attached demo code, should work from v9 through oe10 (although v8 may have problems with STRETCH-TO-FIT option on image [which is not critical, just plays a part in window resize].
I am sure you can do better with the graph presentation [free demo "quality" only ]. There are also samples of using MSOffice components around, however the advantage of something like fly is 1) no requirement on an MSOffice install, and 2) same graph code can run within html and/or appserver delivery. We tend to build 3rd party images/docs/reports etc on a AppServer 'report' engine - this way the client does not need any pre-installed software (only displays image/results) and the server install set is under our control (no user/os removal of required files from desktop). Same story with Crystal reports (client has required CRPE dll set in local library, dll load controlled via prowc.exe.local or prowin32.exe.local pre-CLR trickery).
Oh, sample 'ipDrawBarGraph' code credit belongs to another helping hand from a long time ago ... if only I could remember who
1]
I don't want use MSOffice if possible, but the free\os\share - ware possible.
2]
I'm a dommie and this advanced programming is hard for me.
OCX what is? O_o
DLC what is? o_O
I've only this path:
D:\Corso Progress di 4GL-ABL in SISGE\cnovero\OpenEdge_101B_Doc\webinstall\sports2000\dlc
Message was edited by:
matrixbob
A]
I've OE Architect 10.1B ...
B]
demo.w (12.7 K) use MSOffice method or use Fly method?
C]
demo.w is a you code or an example of Progress documentation semples?
(sorry but i've some problem to understand the sintatic/semantic english and 4GL/ABL )
Message was edited by:
matrixbob
The output of "demo.w" is:
http://img76.imageshack.us/img76/488/graphap8.png
, after 15 seconds of x86 Family 6 Model 15 Stepping 2 GenuineIntel ~1729 Mhz os laptop HP Pavilion DV6000.
Message was edited by:
matrixbob
The 'demo.w' code is from some one else - posted a long time ago, I can not remember who .
The code runs in less than a second on my machine (which is similar performance to yours). The image also looks different, not a great graph but better than the result you posted.
We use an inhouse tool ourselves - prefer to have known source code where possible, so not that familar with 'fly'. Did you try running the samples that come with fly itself - not Progress code but it should test the functionality/performance at let you know if it is going to do what you need.