
This may be a little cheeky, but hey - don't ask and you don't get.
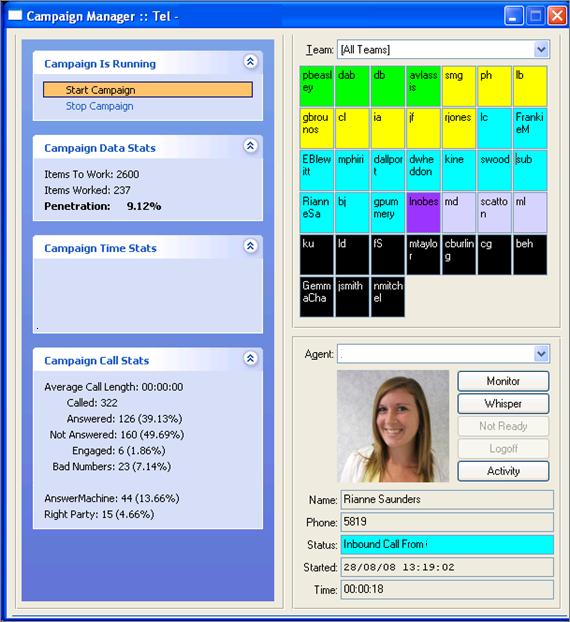
We have this screen in our current system. The grid is what I am looking to replace with a .net control. At the moment, several times a second the grid is refreshed with the all of the agent status colour-coded in order. (i.e all "Ready" (green) are first, followed by "Not Ready" (yellow), "On Telephone" (blue) etc.
As an agent status changes, this screen refreshes. Each of these cells in the grid is an editor, and the grid is changeable as agents / teams are added / removed from the campaign. There may be 1 agent or 55+ agents in this grid at any time). If there is 1 agent, there is 1 cell. 55 agent = 55 cells. You get the picture
I have replaced the navbar and agent portions with appropriate .net controls, but want to replace the grid with something. I just can't figure out what. The obvious control would be a grid but I can't help thinking that there may be a better way of representing the data.
At the moment, the users really like the screen, so I just want to make it look better .
Any tips, hints, comments or help would be gratefully received.
Thanks
Sounds like a question for Arthur Fink
Different colours will help - to protect my eyes. Are you just looking for something to create a freshed impression of do you need to display additional information near the agent names?
Heh. The colours are chosen by the users. There is NO way I want to get involved in that sort of thing
My current thinking was to have a more "softer" grid (not so harsh gridlines), perhaps with just the colours. When you move a mouse over the grid, it sort of "bubbles" with the item currently under the mouse expanded with a card-view of the item in question.
A great example of this would be the telerik bubble-type-thingy. I'm trying to get a demo coded for abl.
If you don't need gridlines, how about something floating?
Microsoft has a flow layout control. You can add Controls and they float to fill the first row from left to right, than the next row ... When you add width the first row will automatically take more items. Then you remove the width, it will require more rows.
You can add any Control to the flow layout control. A panel with some labels and images, ...
mmmm. I suppose that the panel could also fill the parent container as well. I could then magnify the panel in question.
A little cloud of dust signifies that jmls has turned his attention back to the OEA
Oh! Oh! Oh!
How about a chart for each type of call ? Perhaps a pie chart With the size of the segment a proportion of how long in total that segment has been at that status.
or several of the other really funky charts that are available.
mmmmm.
And, of course, this is where Arthur would caution you to not get wrapped up in what you can do, but instead encourage you to go to the users and find out what they need to do the job. Too much information at once just becomes a blur. Going to charts sounds like something you should think of for a dashboard, but then you are monitoring summary information, not individual calls. Only when you drill down in an alert do you see the detail.
I.e., if we actually had the slightest clue how this screen was being used, we might make meaningful suggestions instead of just pointing out various cool things we have seen.
Not to rain on your parade or anything ...
p.s., how was my Arthur imitation? I wonder if he does one of me?
p.s., how was my Arthur imitation? I wonder if he
does one of me?
One might thing it was not bad.
But Thomas is right. You wrote, that the grids get updates many times during a second. I can hardly believe, how a user could focus on any relevant information in a char while the carts constantly change (subsecond).
Message was edited by:
Mike Fechner
instead encourage you to go to the users and find out
what they need to do the job.
Heh. I have mastered the art of making them think that they thought of it in the first place and I'll implement it against my own better judgment.
I.e., if we actually had the slightest clue how this
screen was being used, we might make meaningful
suggestions instead of just pointing out various cool
things we have seen.
The team leaders use this to monitor the campaign (outbound calls), and what level of each status we have . They generally see "ooh, that's a lot of Not Ready" and then click on each "Not Ready" square to see the salient information in the Agent box below.
Conversely, one of the problems they have at the moment is seeing which agent is in which square (ie they are looking at agent first, and not "Agent Status"). They have to pick the agent from the combo-box.
Not to rain on your parade or anything ...
Not at all. The present screen is functional. I want to make it what the users need.
yes, the grid does get updated many times a second. However, if they have selected a cell, then that agent is followed across refreshes even when their status changes.
The agent status colours are arranged together because it lets the leader see at a glance the rough proportion of each status without having to delve into numbers.
Perhaps the grid solution is better after all.
yes, the grid does get updated many times a second.
However, if they have selected a cell, then that
agent is followed across refreshes even when their
status changes.
The agent status colours are arranged together
because it lets the leader see at a glance the rough
proportion of each status without having to delve
into numbers.
Perhaps the grid solution is better after all.
Something off the top of my head on a long, long, long Friday afternoon ...
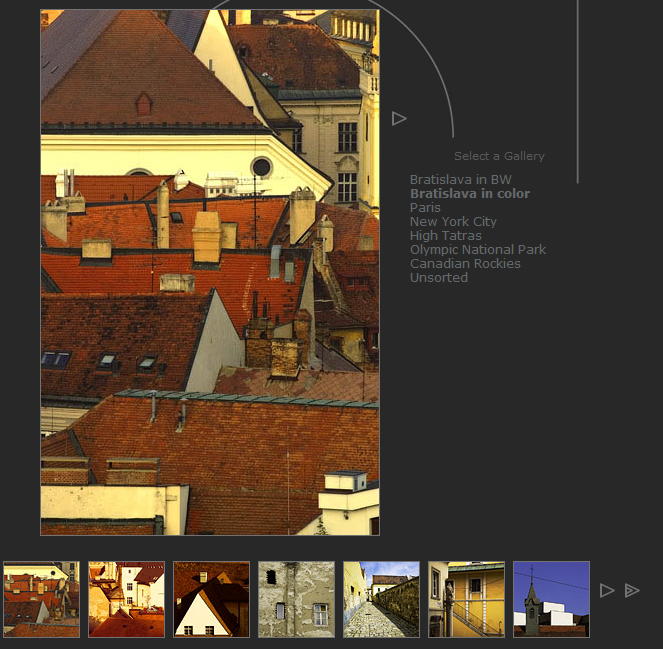
I don't know if you've seen the way Kodak Gallery (I think) presents its albums. Basically you have one main picture - the selected one - and a gallery of the remaining pictures below, as thumbnails. The attached pic kinda shows that. Now you could arrange all the calls by colour and make them as big or small as needed, and then show the details when one's clicked.
-- peter
So, this description sounds like it might actually be served by a summary display with drill down. With all that flashing about, they can't possibly follow an individual in all this ... and, anyway, if they wanted to monitor an individual, a different screen showing both historical patterns and current status would be appropriate. Why not a simple bar chart with number in each status and then drill down into some detail if one of those looks like it needs attention.
Or, you could always integrate Apama to do CEP on the changing status and provide alarms.
So, this description sounds like it might actually be
served by a summary display with drill down. With
all that flashing about, they can't possibly follow
an individual in all this
As mentioned above, if they select an individual from the combobox, then the agent screen stays on them regardless of the status change. When they click on a grid, they also select the agent and it sticks there. The grid may change constantly to reflect the current combined call statuses , but the agent stays the same.
... and, anyway, if they
wanted to monitor an individual, a different screen
showing both historical patterns and current status
would be appropriate.
They have that elsewhere.
>Why not a simple bar chart
with number in each status and then drill down into
some detail if one of those looks like it needs
attention.
At the moment the grid is sorted by colour, with each colour sub-sorted by lenght of time on that status. That's why I considered a pie-chart for each "colour" (or any other chart) that would show the segments in relative size for the length of time each cell has been at that status.
All good food for thought.
Something off the top of my head on a long, long,
long Friday afternoon ...
It is that
I don't know if you've seen the way Kodak Gallery (I
think) presents its albums. Basically you have one
main picture - the selected one - and a gallery of
the remaining pictures below, as thumbnails. The
attached pic kinda shows that. Now you could arrange
all the calls by colour and make them as big or small
as needed, and then show the details when one's
clicked.
thanks!
So, if this is a supervisor's screen and he or she is supposed to be able to monitor several different things, then perhaps one should think in terms of a series of applets, each designed for a particular purpose.
For the overview process, it sounds like they are interested in a combination of the distribution of status and how long each call has been in the status. This, of course, sounds a lot like the sort of thing one monitors with Apama. So, how about starting with a simple bar chart which shows number of calls in each status and then clicking on a status produces a chart below that with the distribution of time in status. Clicking on one of those bars gives a list of calls for that status and duration with the agent and whatever else might be relevant in a tabular form. Clicking on the agent shifts the agent monitor to that agent.
Meanwhile, behind the scenes Apama style, define some models for time in status, monitor that continuously, and pop up an alert when some boundaries are exceeded. Clicking on the alert brings up the agent. Also, monitor the number of calls in status against a model and do something attention getting to the bar chart of number per status when boundaries are exceeded.
I.e., Arthur-like, step back from anything in the current display and first document what the supervisors are trying to monitor ... not what they are doing now, but what their bosses would like them to be doing, whether they are able to do it or not. Combine that with the reality of the actual supervisor and how the current screen helps or doesn't help and mix in the interesting observations and unusual experiences.
thanks to all who have responded so far. The information is invaluable.