
I was developing a MDI application having 5-10 child forms. I noticed that the application was using around 150MB of memory when I viewed the prowin32 process in the taskmanager.
As the user was launching the child forms and then closing it and launching the same form the memory use was increasing to as much as 500 MB within a minute or so.
I think I am deleting all the forms on close of form.
This sounds like a memory leak to me.
I have tried to reproduce the same behavior using a very simple application that connects to the sports2000 database.
You can run the application as C:\Progress\OpenEdge\bin\prowin32.exe -p I:\User\Leak\MemoryLeak\Start.p -db I:\User\Sports2000\sports2000.
start.p is starting procedure.
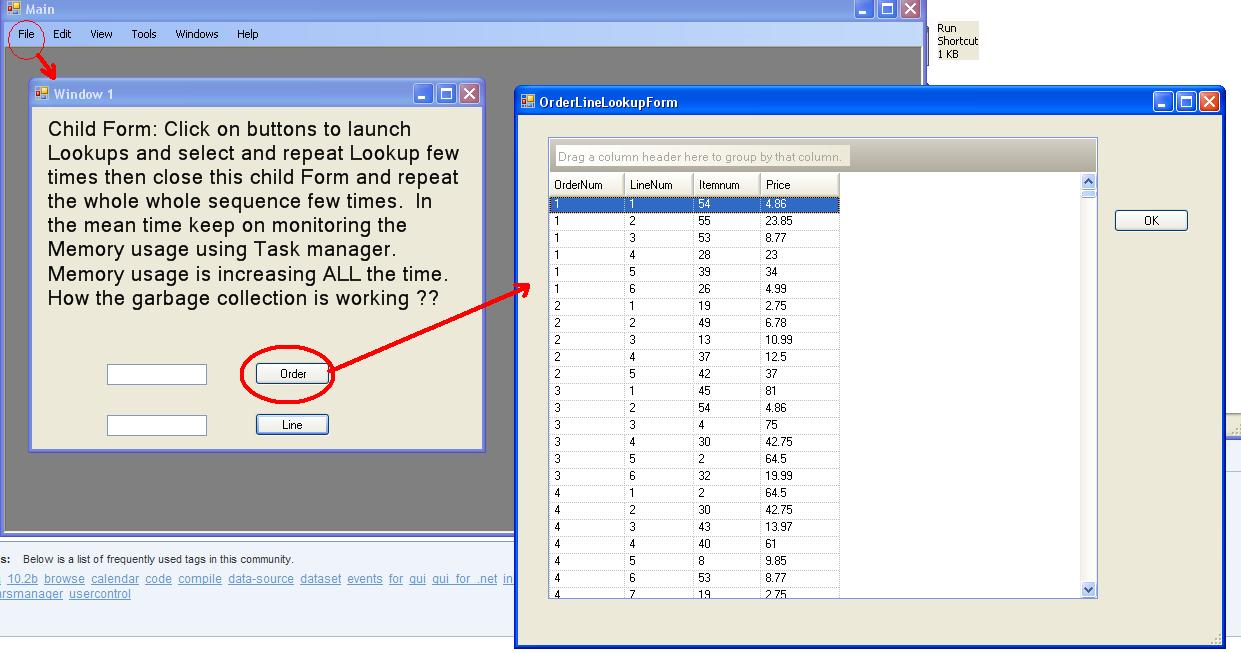
It launches the MDI parent form Main.cls.
Please note down the memory use using task manager.
Please go to the FILE => NEW to launch the child form.
This form has two buttons that launch the Lookup forms. Please click these two buttons few times to launch the Lookup forms then close them. You will notice that memory use is increasing for prowin32 process.
Launch a second or third and so on instance of CHILD form using FILE => NEW ... Then Close the child form then launch it again and then launch the LOOKUP forms again...
After about a minute or so .. I have seen the memory usage going from 35MB to 130 MB.
Why it is happening ?
In the Lookup button events I am cleaning up the object with DELETE OBJECT formOrderLookup etc .
I have also added the MESSAGE statements in the destructors to verify that the DESTRUCTOR is being called at the right moment.
But why memory usage of PROWIN32 is increasing in the TASK MANAGER.
The memory usage stays there even if the close all the MDI CHILD forms.
I am attaching the project and the code is very easy to follow.
Is there a tool that can find out if there is a memory leak or its the default behavior or Progress ABL ??
How to find out when garbage collector is running and which objects it has collected.
I am explicitly cleaning all object using DELETE OBJECT formxyz statements.
thanks in advance for your help and comments about it
[View:~/cfs-file.ashx/__key/communityserver-discussions-components-files/19/MemoryLeak.zip:550:0]
artimus wrote:
I was developing a MDI application having 5-10 child forms. I noticed that the application was using around 150MB of memory when I viewed the prowin32 process in the taskmanager.
As the user was launching the child forms and then closing it and launching the same form the memory use was increasing to as much as 500 MB within a minute or so.
I think I am deleting all the forms on close of form.
This sounds like a memory leak to me.
I have tried to reproduce the same behavior using a very simple application that connects to the sports2000 database.
You can run the application as C:\Progress\OpenEdge\bin\prowin32.exe -p I:\User\Leak\MemoryLeak\Start.p -db I:\User\Sports2000\sports2000.
start.p is starting procedure.
It launches the MDI parent form Main.cls.
Please note down the memory use using task manager.
Please go to the FILE => NEW to launch the child form.
This form has two buttons that launch the Lookup forms. Please click these two buttons few times to launch the Lookup forms then close them. You will notice that memory use is increasing for prowin32 process.
Launch a second or third and so on instance of CHILD form using FILE => NEW ... Then Close the child form then launch it again and then launch the LOOKUP forms again...
After about a minute or so .. I have seen the memory usage going from 35MB to 130 MB.
Why it is happening ?
I'd first make sure that I'm calling Close() on the MDI children, and releasing all references. Also make sure you unsubscribe any events that those children subscribe to.
As for general tools, take a look at the doc around the LOG-MANAGER system handle and it's CLI equivalents. There's a section in the Debugging & Troubleshooting doc called "Logging in OpenEdge" that will be useful. OE Architect also has built-in support for this in the run configurations.
There are also tons of resources on related materials on this site.
How to find out when garbage collector is running and which objects it has collected.
I am explicitly cleaning all object using DELETE OBJECT formxyz statements.
The GC is always running unless you've explicitly disabled it with the -nogc switch. The log manager will tell you which objects have been GC'ed.
-- peter
Thanks Peter:
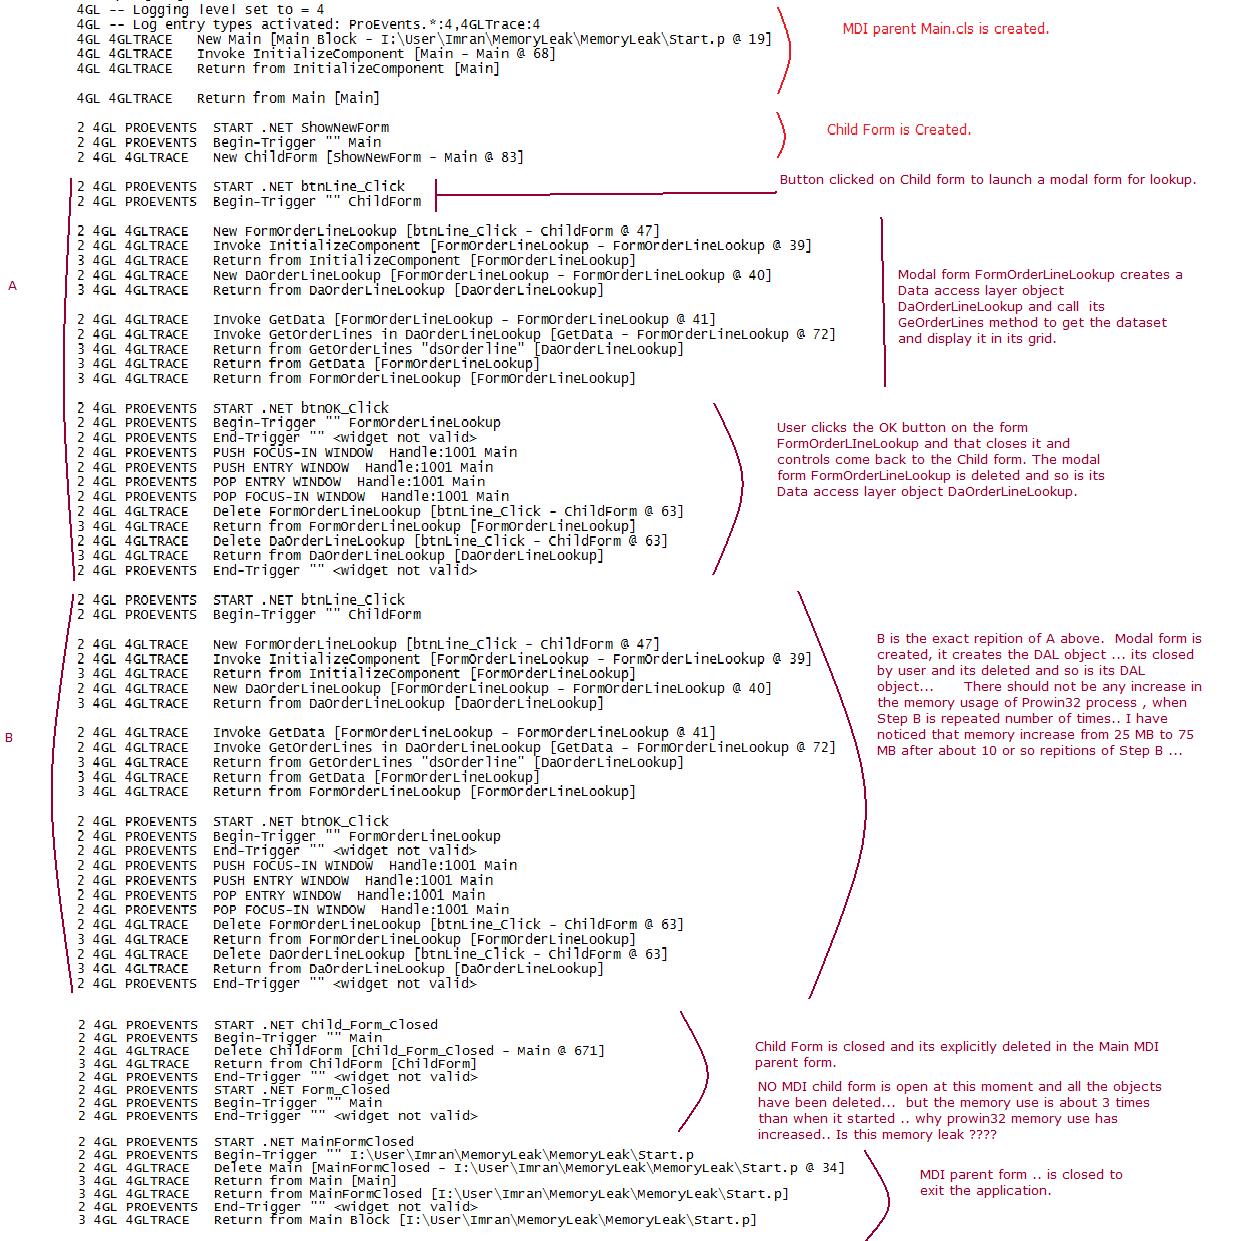
Actually I had used the log manger at command line to test my application.
I am logging events as
C:\Progress\OpenEdge\bin\prowin32.exe -clientlog I:\User\IMemoryLeak\_UI.log.log -logentrytypes ProEvents.*:4,4GLTrace:4 -logginglevel 4 -p I:\User\Imran\MemoryLeak\MemoryLeak\Start.p -db sports2000
I am also attaching the screenshot of the logfile and the actual log file also. Please look at the attached files.
All the objects generated using New are being deleted but still the memory use of prowin32 increasing. I can not figure out what is the reason.
You have mentioned that .... "Also make sure you unsubscribe any events that those children subscribe to."
Assume the following scenario...
There is a form and this form has 10 buttons. Each button has an event attached to it.. So there are 20 subscribe statements in the initialize method of that form.
Are you saying that I have to add 20 Unsubscribe statements ( one each of the button) somewhere in the form code.cls file.
If so then what is the right place to do it...
My assumption is that if i am deleting this form using "delete object frmObject" then the whole object should be garbaged by tthe run time ...
[View:~/cfs-file.ashx/__key/communityserver-discussions-components-files/19/3652.UI.log.zip:550:0]
thanks again for the comments...
Other things may consume memory as well.
First, the .NET framework and your referenced assemblies are loaded when first used and never unloaded until the client terminates.
Check for ABL widgets, like TABLE-HANDLE parameters etc.. They are not GCed. If you don't delete them properly the keep eating memory...
Don't use a shared memory DB connection. Use an AppServer client when possible. I've got confused once or twice by growing memory caused by DB cache on the client and similar. An AppServer connection doesn't use cache, so it's easier to compare memory consumption.
First, the .NET framework and your referenced assemblies are loaded when first used and never unloaded until the client terminates.
I agree .. when a lookup form is loaded the referenced asseblies are loaded and memory use increase by lets say 10 MB... if this form is closed and launched again.. then exactly the same steps are carried out then its should not increase memory use as referenced asseblies are already there.. In my case the memory use is keep on increasing...
Check for ABL widgets, like TABLE-HANDLE parameters etc.. They are not GCed. If you don't delete them properly the keep eating memory...
I dont' have any table-handle parameters etc..
Don't use a shared memory DB connection. Use an AppServer client when possible. I've got confused once or twice by growing memory caused by DB cache on the client and similar. An AppServer connection doesn't use cache, so it's easier to compare memory consumption.
Do I have to rework my whole application so that it can run on Appserver ?? and then write th UI part that can connec to Appserver and call the business logic ??
Mike thanks for the additional insight...
Arain
Do I have to rework my whole application so that it can run on Appserver ?? and then write th UI part that can connec to Appserver and call the business logic ??
Don't get me wrong. Also a client-server app should not have memory leaks. It's just that I've seen some memory increases with client-server apps even when everything is coded right. But yet, that would require some rework.
One thing you need to know about the GC: The ABL GC runs immediately. The .NET GC may run delayed, after the object instance is no longer referenced from the ABL and the .NET side.
mikefe wrote:
Other things may consume memory as well.
....
Don't use a shared memory DB connection. Use an AppServer client when possible. I've got confused once or twice by growing memory caused by DB cache on the client and similar. An AppServer connection doesn't use cache, so it's easier to compare memory consumption.
Just to clarify, I assume you mean by that last statement that you should not use a shared memory connection ***when you are testing memory consumption** with the AppServer?
Reason I ask is that my experience tells me that if you can conceivably use a shared memory connection to connect to the database from the AppServer, you should *definitely* use it because the performance gain is significant.
As you say, though, it blurs the line with memory consumption testing and therefore means that verifying memory leaks requires a client-server AppServer connection.
That's exactly my point! Use shared memory connections whenever possible!
But don't use them when you want to use the memory column in the Windows task manager to measure the current memory consumption of a (prowin32) process. Use an AppServer connection instead of any DB connection on the client.
I have logged my application using DynObject.* CLI option. It can show all the .NET objects created and deleted by the GC etc.
As my child form is launching a modal lookup form. This lookup form has an ultragrid control and ultrabutton.
There are four columns in the UltraGrid and inside the method METHOD PRIVATE VOID InitializeComponent( ): there are following four statements that generate these four columns.
DEFINE VARIABLE ultraGridColumn1 AS Infragistics.Win.UltraWinGrid.UltraGridColumn NO-UNDO. ultraGridColumn1 = NEW Infragistics.Win.UltraWinGrid.UltraGridColumn("OrderNum"). @VisualDesigner.FormMember (NeedsInitialize= "true"). DEFINE VARIABLE ultraGridColumn2 AS Infragistics.Win.UltraWinGrid.UltraGridColumn NO-UNDO. ultraGridColumn2 = NEW Infragistics.Win.UltraWinGrid.UltraGridColumn("LineNum"). @VisualDesigner.FormMember (NeedsInitialize= "true"). DEFINE VARIABLE ultraGridColumn3 AS Infragistics.Win.UltraWinGrid.UltraGridColumn NO-UNDO. ultraGridColumn3 = NEW Infragistics.Win.UltraWinGrid.UltraGridColumn("Itemnum"). @VisualDesigner.FormMember (NeedsInitialize= "true"). DEFINE VARIABLE ultraGridColumn4 AS Infragistics.Win.UltraWinGrid.UltraGridColumn NO-UNDO. ultraGridColumn4 = NEW Infragistics.Win.UltraWinGrid.UltraGridColumn("Price"). Since these UltraGridColumns are created inside the method Initialize object then I have no reference anywhere else about How to delete them manually/explicity !! !!! !!! Certainly .NET garbage collector is not cleaning them. Whereas in the same InitializeComponent method there are other NEW object creations such as DEFINE VARIABLE tableDesc1 AS Progress.Data.TableDesc NO-UNDO. tableDesc1 = NEW Progress.Data.TableDesc("ttOrderLine"). @VisualDesigner.FormMember (NeedsInitialize= "true"). DEFINE VARIABLE appearance4 AS Infragistics.Win.Appearance NO-UNDO. appearance4 = NEW Infragistics.Win.Appearance(). @VisualDesigner.FormMember (NeedsInitialize= "true"). DEFINE VARIABLE ultraGridBand1 AS Infragistics.Win.UltraWinGrid.UltraGridBand NO-UNDO. ultraGridBand1 = NEW Infragistics.Win.UltraWinGrid.UltraGridBand("ttOrderLine", -1). These .NET objects are perefectly being garbage collected the .NET GC. Probably this is the reason why prowin32 memory usage is increasing over time. Any ideas ? Arain
NEW Infragistics.Win.UltraWinGrid.UltraGridColumn("Price").
Certainly .NET garbage collector is not cleaning them.
When they don't get cleaned up "after a while", I'd report that issue to Progress tech-support for investigation.
Hi,
I am currently out of the office and will be returning on July 19th.
If you need immediate assistance please contact Jim Stein at
jstein@cornerstar.com.
Thanks,
Bryn Dearborn
503-805-8598
--
Bryn Dearborn
503-928-8115 (Work)
503-805-8598 (Cell)
www.cornerstar.com
What version of OpenEdge are you using?
In 10.2A03, there's a bug that causes a memory leak on every automatic casting of EXTENT to .NET array.
E.g. (this kind of code is abundantly generated by the Visual Designer)
DEFINE VARIABLE arrayvar0 AS System.Object EXTENT 3 NO-UNDO.
arrayvar0[1] = ultraGridColumn1.
arrayvar0[2] = ultraGridColumn2.
arrayvar0[3] = ultraGridColumn3.
ultraGridBand1:Columns:AddRange(arrayvar0).
There will be a memory leak on AddRange(arrayvar0) of the three ultraGridColumn, they will never get garbage collected whatever you do.
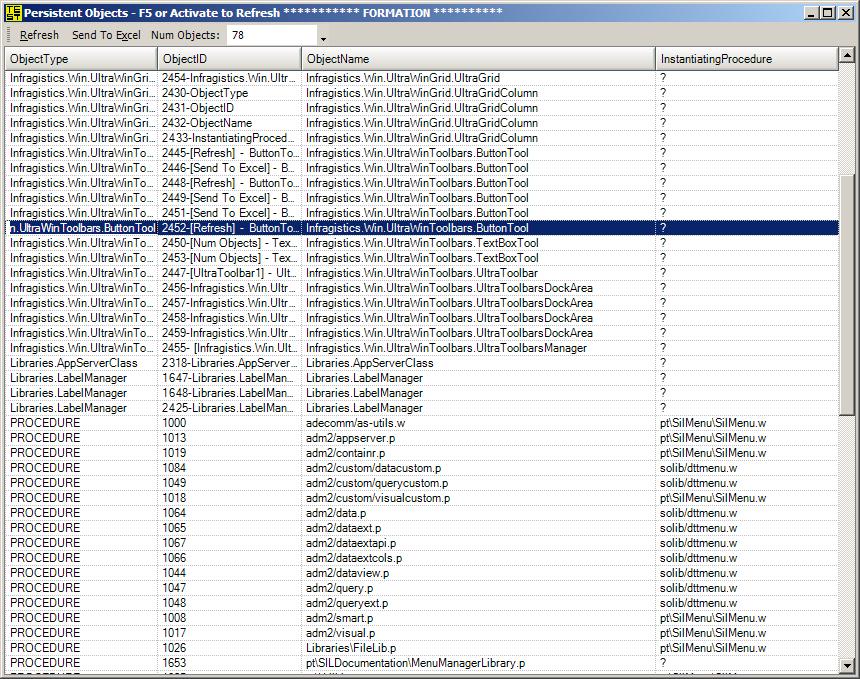
You can run the attached file with:
DEFINE VARIABLE objShowPersistentObjects AS CLASS ShowPersistentObjects NO-UNDO.
objShowPersistentObjects = NEW ShowPersistentObjects().
objShowPersistentObjects:Show().
while your program is running and each time you'll click back on the ShowPersistentObjects, it will be refreshed and show you the objects that are currently loaded in memory and the list will possibly be growing.
The program calls:
System.GC:Collect().
System.GC:WaitForPendingFinalizers().
System.GC:Collect().
to try to force .NET garbage collection before it shows the objects that are still in memory.
[View:~/cfs-file.ashx/__key/communityserver-discussions-components-files/19/ShowPersistentObjects.cls.zip:550:0]
What are the CLI equivalents of the LOG-MANAGER? Are they available directly in the .NET framework or are they separate download?
dlauzon wrote:
What are the CLI equivalents of the LOG-MANAGER? Are they available directly in the .NET framework or are they separate download?
You can run your application as prowin32.exe -clientlog C:\tmp\MyLog.log -logentrytypes DynObjects.*:4,ProEvents.*:4,4GLTrace:4 -logginglevel 4 -p MyApplication.p -db sports2000 -H localhost -S 2556
For additional notes please look at the table 5-12 in chapter 5 of progress documentation "OpenEdge development: debugging and troubleshooting".
Arain
Hi Arain, thanks for your answer, but I'm not looking for the ABL log-manager, I'm looking for a .NET Common Language Infrastructure equivalent of what we have in ABL as the ABL log-manager only tracks ABL code and not native .NET code that is invoked.
E.g. if I call the "Show" method on a .NET Form from ABL, with the ABL log-manager (or equivalent startup parameters), I don't see all the .NET calls that this Show method then invokes, that's why I'm looking for a .NET equivalent.
dlauzon wrote:
What version of OpenEdge are you using?
In 10.2A03, there's a bug that causes a memory leak on every automatic casting of EXTENT to .NET array.
E.g. (this kind of code is abundantly generated by the Visual Designer)
DEFINE VARIABLE arrayvar0 AS System.Object EXTENT 3 NO-UNDO.
arrayvar0[1] = ultraGridColumn1.
arrayvar0[2] = ultraGridColumn2.
arrayvar0[3] = ultraGridColumn3.
ultraGridBand1:Columns:AddRange(arrayvar0).
Yes this bug is there even in 10.2BSP01. Progress says that this is fixed in SP02 to be released in September 2010.
I can also detect these orphan objects by placing a hard breakpoint (e.g. DEBUGGER:INITIATE(). DEBUGGER:SET-BREAK().) to start the debugger at the beginning of object creation that uses ultragridcolumn and another hard breakpoint when deleting it . Once the debugger is active access the Dynamic Object Tracking feature under the “Diagnostics” menu, select all of the object types by placing a check next to each, then select the “Start Monitoring” button at the bottom of the dialog.
Once done you can click the Close button at the bottom of the Dynamic Object Tracking dialog and continue with the application normally.
When the debugger hits breakpoint at the second place when object is deleted access the Dynamic Object Tracking dialog again and select the View Objects tab to see how many objects are left behind.
I can see that whenever the grid was used in the form all the ultragridcolumns are never cleaned up and left as orphans.
There are several tools for .net. If you need assembly information you can use fusion.
http://msdn.microsoft.com/en-us/library/e74a18c4%28VS.71%29.aspx
If you need memory allocation/profiling then YourKit for.NET (http://yourkit.com/) or similar can be used.
I don't know of a pure execution tracing product.
Just wondering if you are using USE-WIDGET-POOL in your form class definition?
My understanding is that widgets are not scoped to the class instance. They are scoped to the WIDGET-POOL that AVM found when the object is created. If it happens to be the default unnamed pool (application level) then there is a big chance that the reference count to the objects are not decrementing to zero because the WIDGET-POOL still has references to those objects.
I believe USE-WIDGET-POOL allows the form to have its own widget-pool thus making the form's objects to be created into that pool. When the form is closed (hopefully same thing is true when the form just goes out of scope) so does the WIDGET-POOL.
Give us an update if the memory is still growing even when using USE-WIDGET-POOL. Thanks
Don't use a shared memory DB connection. Use an AppServer client when possible. I've got confused once or twice by growing memory caused by DB cache on the client and similar. An AppServer connection doesn't use cache, so it's easier to compare memory consumption.
I rewrote the DAL layer of my application to connect it to the Appserver and get the data from Appserver. But absolutely no improvement in the memory usage. Something is wrong in the UI layer.
jquerijero wrote:
Just wondering if you are using USE-WIDGET-POOL in your form class definition?
I was not using USE-WIDGET-POOL ... BUT It made no difference even after using USE-WIDGET-POOL.....
Check the "log-manager" handle - it'll provide a way to track the lifecycle for dynamic objects so you can see what's being created and not deleted.
timk519 wrote:
Check the "log-manager" handle - it'll provide a way to track the lifecycle for dynamic objects so you can see what's being created and not deleted.
Tim : we had already done that before posting on forum and still memory is going somewhere....
Hi,
Thank you for your email. I'm currently out of the office on vacation. I will return on August 23. During my absence I will have no or very limited access to my email. For urgent matters, call me on my mobile and leave a message on my voice mail or call our office.
Best regards,
Wouter.
--
Wouter Dupré
Senior Solution Consultant
Progress Software NV
Stocletlaan 202 B| B-2570 Duffel | Belgium
Direct Line +32 (0) 15 30 77 00 | Mobile +32 (0) 478 50 00 49
wdupre@progress.com
artimus wrote:
function(){return A.apply(null,[this].concat($A(arguments)))}timk519 wrote:
Check the "log-manager" handle - it'll provide a way to track the lifecycle for dynamic objects so you can see what's being created and not deleted.
Tim : we had already done that before posting on forum and still memory is going somewhere....
The log-manager handle can be used to help figure out where the memory's going, it doesn't stop the memory leaks for you.
timk519 wrote:
artimus wrote:
function(){return A.apply(null,[this].concat($A(arguments)))}timk519 wrote:
Check the "log-manager" handle - it'll provide a way to track the lifecycle for dynamic objects so you can see what's being created and not deleted.
Tim : we had already done that before posting on forum and still memory is going somewhere....The log-manager handle can be used to help figure out where the memory's going, it doesn't stop the memory leaks for you.
Tim.. thats what I had written .. log-manager is not detecting any memory leak.. all the ojects created are being Garbage collected....
You're referring to "class" objects, there's also non-class objects (dynamic query, buffer, TT, etc.) that need to be checked as well. Since they're not garbage-collected, they have to be in a widget-pool that's deleted or gone out of scope, or explicitly deleted by code.