
Hello,
Are there any ways to access from third-party systems to the statistics that are collected by OpenEdge Management?
For example, from Zabbix or something like that...
Andriy
The oem uses progress vst tables under-the-hood (at least for OE-database-related information). You could access vst's directly (and they are fairly well documented).
That is probably the "right" answer.
But you can inspect the traffic that is being sent back-and-forth to the browser while you are using OEM. You will find that will often pull up a JSON-formatted data file, before rendering it to HTML for visualization. This JSON stuff is probably NOT well documented, and the JSON is likely to change over time (although not at a rapid pace).
However I find it more comforting to use these JSON files than to go get the VST's directly. Sometimes there are obscure tricks to querying the VST's and if you don't do it just right, you will have an inefficient query or worse (negatively affect the server itself). I recall that using certain VST's the wrong way (maybe it was locks?) would cause the database to become unstable in the past. Those kinds of experiences are hard to forget, even after the bugs are fixed....
If OEM is getting its information from VST's, and you are getting your data from OEM, you can be pretty sure that the flow of data has been well-tested and Progress has optimized it to whatever extent they could.
Below examples for getting raw JSON from oee/oem. In these URL's you will see references to are "mydatabase" which is a scripted-style database. You may want to inspect your own local traffic as you browse normal OEM pages, and find URL's for the JSON equivalent of each page.
Normal OEM page (database connections from scripted database):
myserver:9090/.../dbconnections.jsp
JSON equivalent of database summary view
myserver:9090/.../DatabaseSummaryView
JSON equivalent of connections
JSON equivalent of current user locks
myserver:9090/.../DatabaseLocksViewlet
Hope this helps.
Yup. Reading _Lock table is a recipe for a performance disaster. Don't do it. You can use _UserLock instead.
> Reading _Lock table is a recipe for a performance disaster.
Not an issue since 11.3
> You can use _UserLock instead.
_UserLock with 64-bit Progress has the same issue as _Lock in old releases.
Andriy, when you say 'statistics', do you primarily refer to database statistics or any resource statistics in general?
The database statistics are fetched via VSTs as David and Matt have already pointed out.
In addition, OEM provides a set of REST APIs (starting 11.0 but improved with each OE 11.x version) which can be consumed by third-party systems (including Zabbix). If you would like more information, please let me know and I can pass on more details.
Thank you, guys!
dbeavon,
Thank you, your tip is interesting, I will try to play with it.
rkumar,
I'll try to explain.
My idea is not to do the work that the OEM is already doing.
1. I would like to have access to all the data that OEM collects and that can be useful now or in the future.
2. I don't want to provide access to production databases for third-party systems for security reasons - there's an OEM for that.
3. And Yes, I do not want to connect to VST of databases, in order not to create unnecessary load for them. Including that I might make a mistake somewhere and damage the system.
>>OEM provides a set of REST APIs
It is interesting too. You mean OpenEdge Management REST API framework?
I found about it here:
docs.progress.com/.../OpenEdge-Management-REST-API-framework.html
But unfortunately, I did not understand how this can be used, maybe I don't have enough knowledge.
Do you have more examples of how to do this? For example, how can I use the OEM REST API to get the Buffer Hits history for a specific database from Zabbix?
I see it like this:
1. On the Zabbix side, I will start a process that will be connected to the OEM using the OEM REST API and request data for the period of time since the last connection.
2. OEM returns data.
3. My process saves this data to the Zabbix database.
Another example is how to get the same data directly from OEM for Grafana? (there is Zabbix plugin for Grafana, but if OEM REST API is realy work, I think I can use it in Grafana wthiout Zabbix).
Thanks for your help, I really appreciate it!
Andriy
To my understanding the fathom database in <oemgmt>/db is a 'normal' openedge database, and you can connect to this from 4GL or ODBC/JDBC.
And this database is where trending is saved.
CURRENT-WINDOW:WIDTH = 140.
FOR EACH Cf_Sample NO-LOCK WHERE Cf_Sample.Sample_Type = "23":U,
   FIRST Sys_Cpu NO-LOCK WHERE Sys_Cpu.Sample_ID = Cf_Sample.Sample_ID:
   DISPLAY
   Cf_Sample.Resrc_ID
   Cf_Sample.Sample_Date
   Cf_Sample.Sample_Time
   Sys_CPU.CPU_Wait
   Sys_CPU.CPU_Usr
   Sys_CPU.CPU_System
   Sys_CPU.CPU_Idle
   WITH WIDTH 140
   .
END.
/Torben
[quote user="George Potemkin"]
> Reading _Lock table is a recipe for a performance disaster.
Not an issue since 11.3
[/quote]
Since 11.4 actually, with further tweaks in 11.5.
In 11.5+, assuming a sports2000 database started with -L 500000 a very basic benchmark:
ETIME(TRUE).

FOR EACH _lock:
  icount = icount + 1.
END.

MESSAGE ETIME icount.
Will give sub-second response times under most circumstances. If you're using remote connection and actually have hundreds of thousands of active record locks you might see more human-noticable response times - total size of lock table and number of actual locks used are still the main factors in time to execute.
Same query in 11.3- probably will have you kill your session before it completes, as you'll get tired of waiting before it finishes.
Thank you, Torben!
This is also useful information, I will consider it too.
But for while, I will try to understand how the OEM REST API works, because to access throught ODBC/JDBC on the monitoring server with Zabbix and Grafana needs to install these drivers for OpenEdge and this is undesirable.
[quote user="Torben"]
To my understanding the fathom database in <oemgmt>/db is a 'normal' openedge database, and you can connect to this from 4GL or ODBC/JDBC.
And this database is where trending is saved.
|
1
2
3
4
5
6
7
8
9
10
11
12
13
14
|
CURRENT-WINDOW:WIDTH = 140.FOR EACH Cf_Sample NO-LOCK WHERE Cf_Sample.Sample_Type = "23":U, FIRST Sys_Cpu NO-LOCK WHERE Sys_Cpu.Sample_ID = Cf_Sample.Sample_ID: DISPLAY Cf_Sample.Resrc_ID Cf_Sample.Sample_Date Cf_Sample.Sample_Time Sys_CPU.CPU_Wait Sys_CPU.CPU_Usr Sys_CPU.CPU_System Sys_CPU.CPU_Idle WITH WIDTH 140 .END. |
/Torben
[/quote]
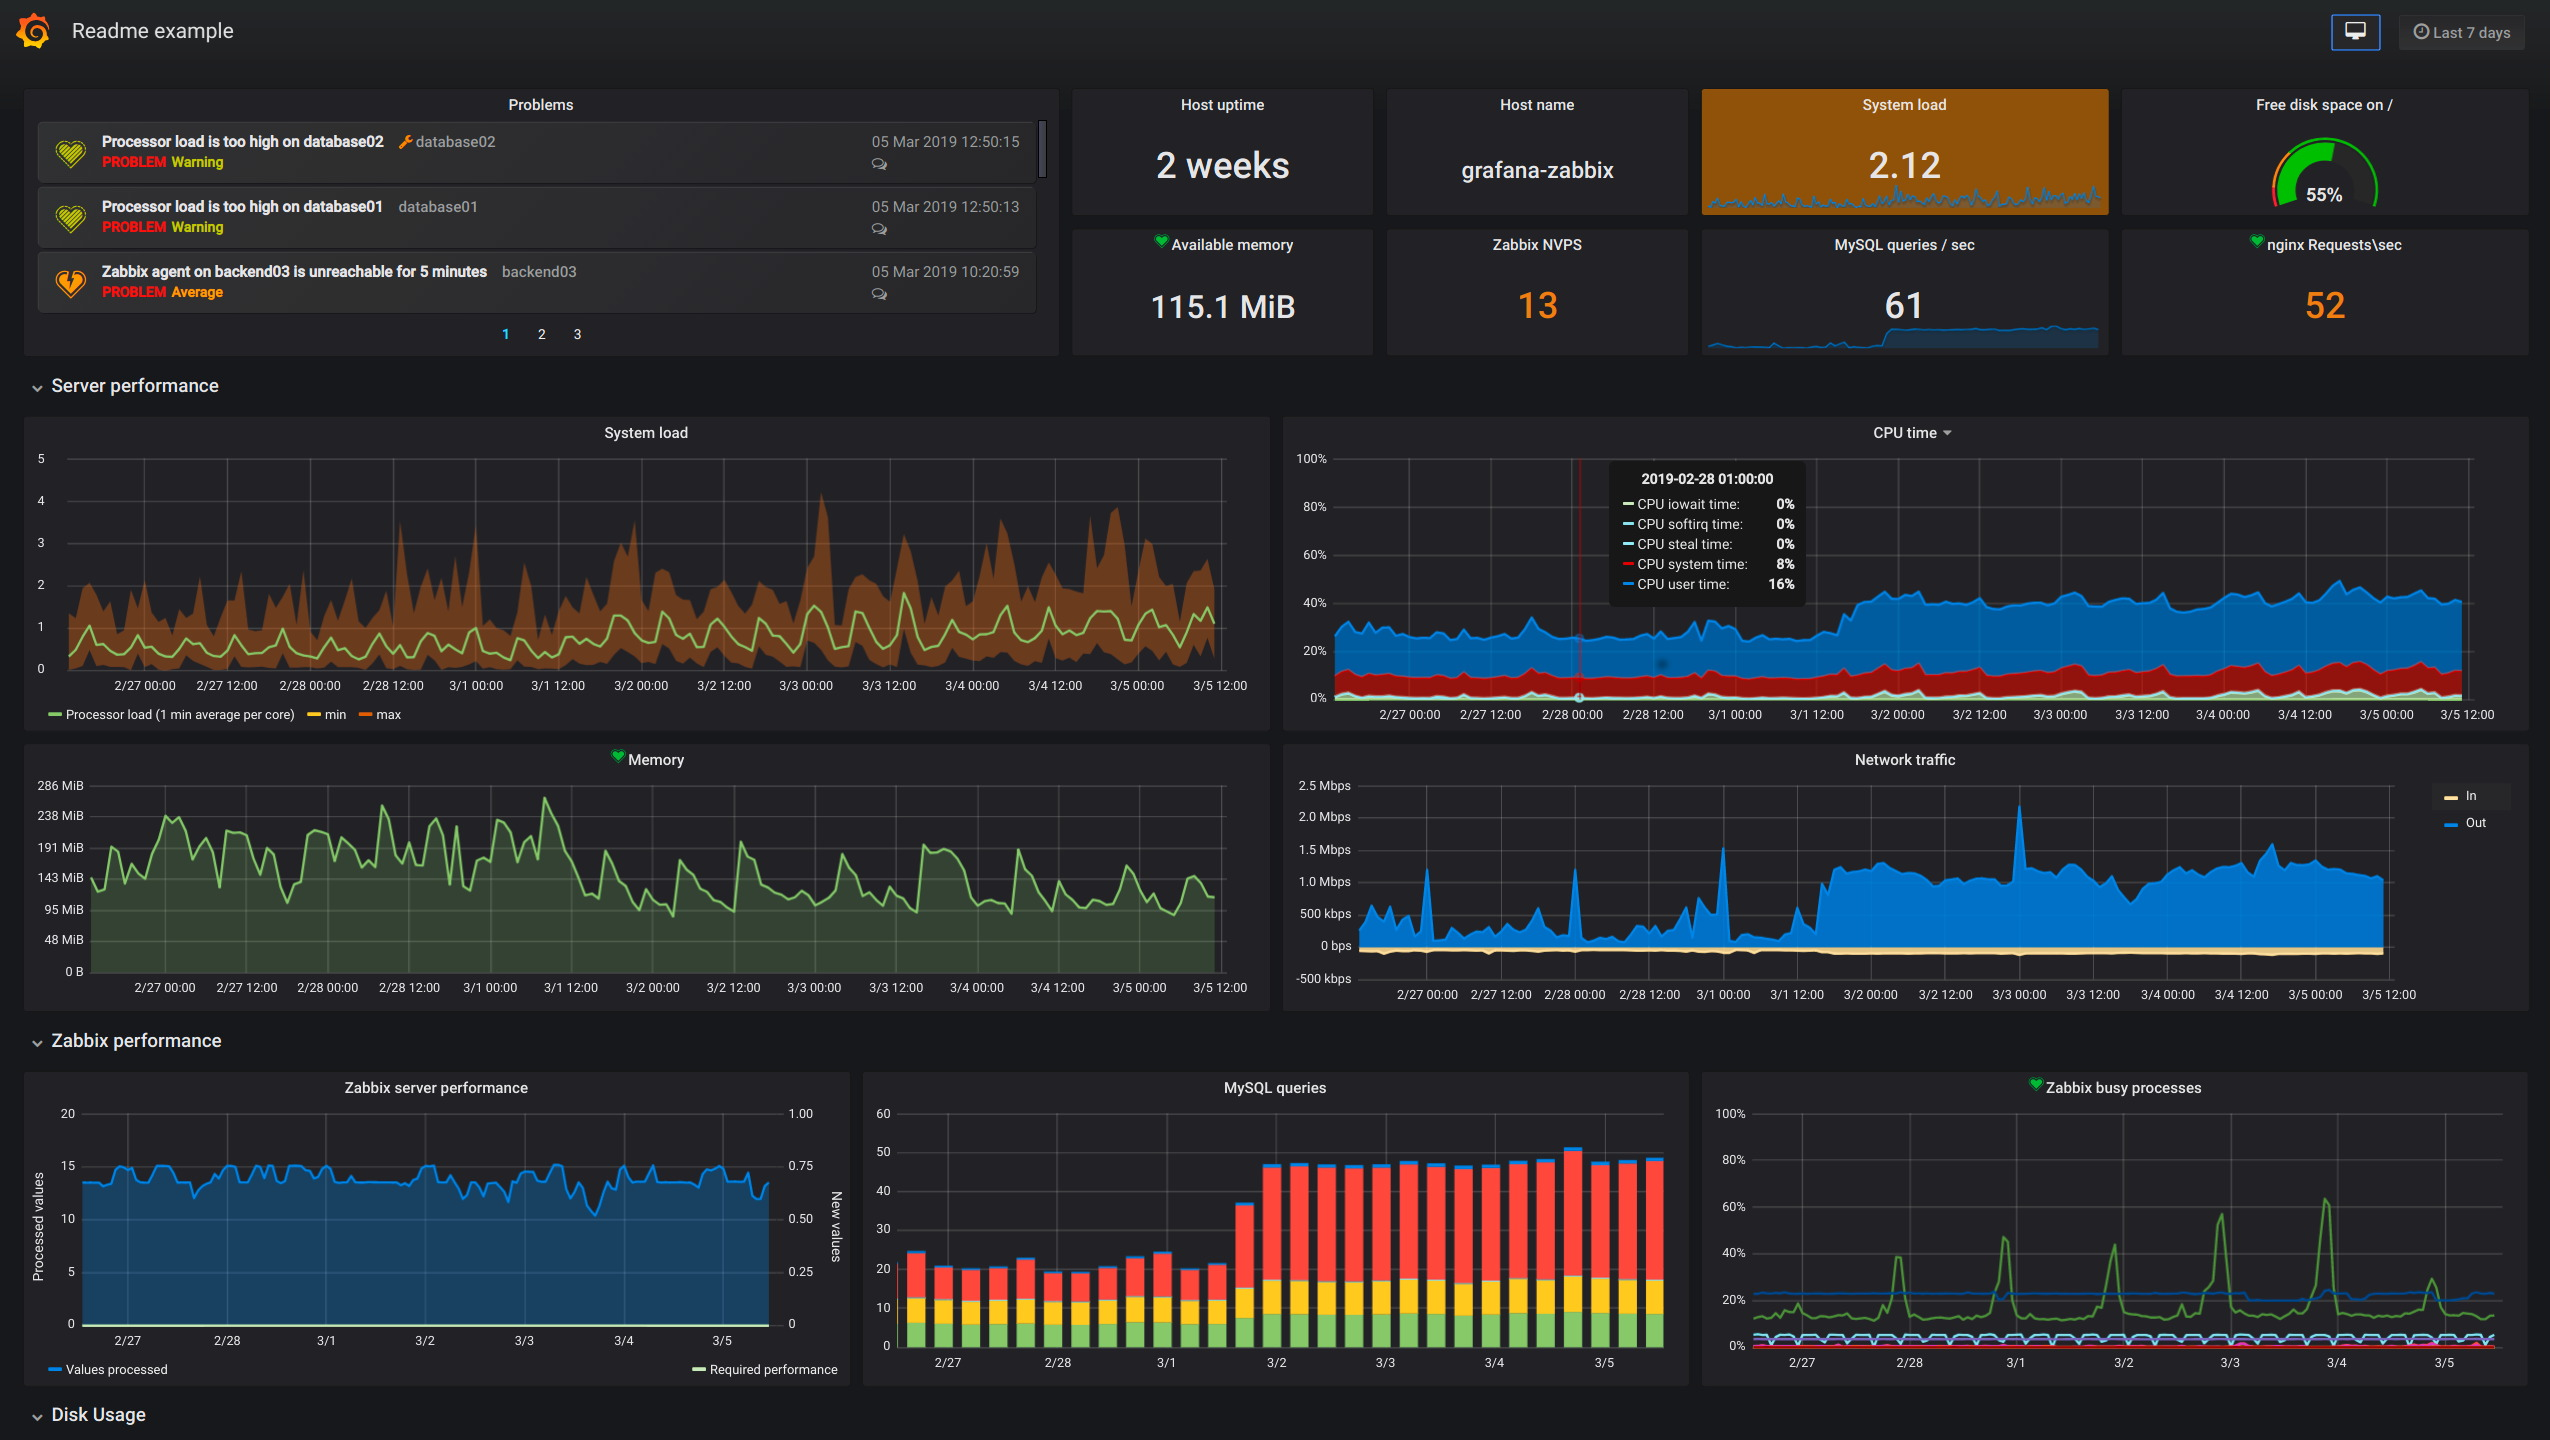
Just want to show you an example of what I want to achieve for OpenEdge monitoring. The following picture is an example of monitoring when using Zabbix plugin for Grafana.
So achieve it then? You have been made aware of the possibilities by either intercepting the API REST calls, or querying the Fathom Trend DB directly using ODBC/JDBC. You would actually need to feed the Grafana with the data. Nobody will do it for you.
>>Nobody will do it for you.
I know. That's why I'm trying to figure it out myself.
Yeah, I am afraid you have a point. I would probably have a client reading vsts (or dbman -vst) to get/massage the data you want to see, send them to either Graphite or Prometheus and then 'do' Grafana against these, well one of them since it has native hooks.
FYI
All OEM REST APIs can be seen using this url http://hostname:port/oem/api