
OpenEdge Release 11.7.3 on Linux 64-bit
Table’s areas are mapped to the primary buffer pool.
Index’ areas are mapped to the alternate buffer pool.
The sizes of the pools are proportional to the total size of the corresponding areas.
Number of LRU force skips (-lruskips): 100
Number of LRU2 force skips (-lru2skips): 100
Statistics below is for 5-minute interval.
Problem:
During the specific operations running at night we have the high number of naps per sec on LRU latch – upto 3103 Naps/Sec. LRU latch is almost 100% busy. LRU locks is upto 9800 Locks/Sec.
LRU2 locks is is just 830 Locks/Sec and 0 Naps/Sec.
Record/Index operations are ~ 62,200 Per Sec
Primary Buffer Pool: Logical reads ~63,050 Per Sec
Alternate Buffer Pool: Logical reads ~ 71,220 Per Sec
Expectation:
LRU Locks ~ Logical reads / (-lruskips)
Formula works for the alternate buffer pool but not for the primary one.
Private buffers take the blocks from and return the blocks back to a primary buffer pool only. Is it possible that the unexpectedly high LRU locks (the primary buffer pool) are caused by the client’s sessions that often update the _MyConn-NumSeqBuffers?
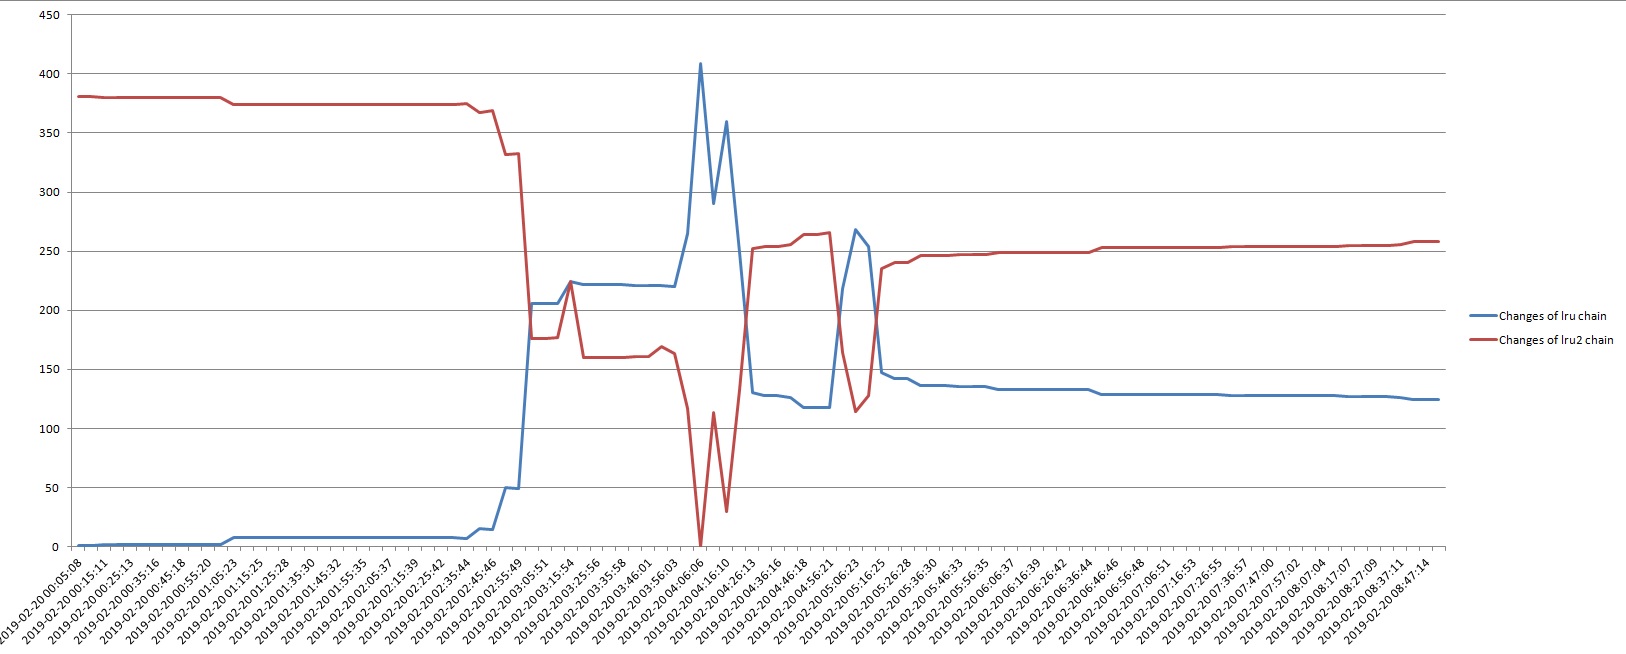
Indeed the number of blocks on LRU chain is changing up and down.
But we got such changes for both chain types (LRU and LRU2).
More over the changes of LRU and LRU2 chains are dissymmetrical!
Why?
I wonder if there are any interesting patterns in _actbuffer._buffer-Active, _buffer-rm, or _buffer-index etc while this is going on?
02/20/19        Activity: Buffer Cache
00:30:23        02/20/19 00:25 to 02/20/19 00:30 (5 min 1 sec)
                                    Total         Per Min          Per Sec          Per Tx
Primary Buffer Pool
Logical reads                    18978066         3783003         63050.05          979.41
Logical writes                       3635             725            12.08            0.19
O/S reads                         2900533          578179          9636.32          149.69
O/S writes                             44               9             0.15            0.00
Writes deferred                      3600             718            11.96            0.19
LRU skips                         5592058K        1114696K     19024144.18       295518.78
LRU writes                             44               9             0.15            0.00
APW enqueues                            0               0             0.00            0.00
Active Blocks                     3998028          796949         13282.49          206.33
Master Blocks                           1               0             0.00            0.00
Index Blocks                           26               5             0.09            0.00
Record Blocks                     3997946          796933         13282.21          206.32
Sequence Blocks                         1               0             0.00            0.00
Object Blocks                          54              11             0.18            0.00
Primary buffer pool hit ratio:  84 %

Alternate Buffer Pool
Logical reads                    21437394         4273235         71220.58         1106.33
Logical writes                      12025            2397            39.95            0.62
O/S reads                           50411           10049           167.48            2.60
O/S writes                           7835            1562            26.03            0.40
Writes deferred                     11510            2294            38.24            0.59
LRU2 skips                              9               2             0.03            0.00
LRU2 writes                             0               0             0.00            0.00
APW enqueues                            9               2             0.03            0.00
Active Blocks                     1000003          199336          3322.27           51.61
Master Blocks                           0               0             0.00            0.00
Index Blocks                       999851          199306          3321.76           51.60
Free Blocks                            44               9             0.15            0.00
Object Blocks                         108              22             0.36            0.01
Alternate buffer pool hit ratio:  99 %
LRU2 replacement policy enabled.
Activity seems to be stayed the same for a long time.
Activity: Buffer Cache => LRU/LRU2 skips
george, are the so-called "private buffers" being used? that could cause blocks to move from one chain to another. also, when blocks get put on the APW queue, the are removed from LRU chain but i see from your stats that there is hardly and APW queue activity.
-Bp buffers have an LRU chain per user. These user specific LRU chains are indeed protected by the one LRU latch (the same one that is used for the general buffer pool -B). Additionally -Bp buffers do not honor any lru skips settings. So lots of -Bp users could have contention on the one LRU latch.
Obviously. looking at this now, there is room for improvement here to implement object latches where each user's -Bp LRU chain is protected by a user specific LRU object latch. Such a direction was probably not possible when I first implemented this. With one LRU latch per -Bp user there would be much less contention amongst users of -Bp. The LRU latch would still be used to move buffers out of the private LRU to the general LRU when access to the same buffer is requested by a different user or if an update were to be made on a buffer in the users -Bp.
I would not expect this LRU contention should not be affecting -B access since if there is little paging and high lruskips the LRU is rarely accessed for the -B.
> are the so-called "private buffers" being used?
The customer got the issue only two days ago. The programmers said: there were no recent changes in the code. I did not expect other reply from them. ;-)
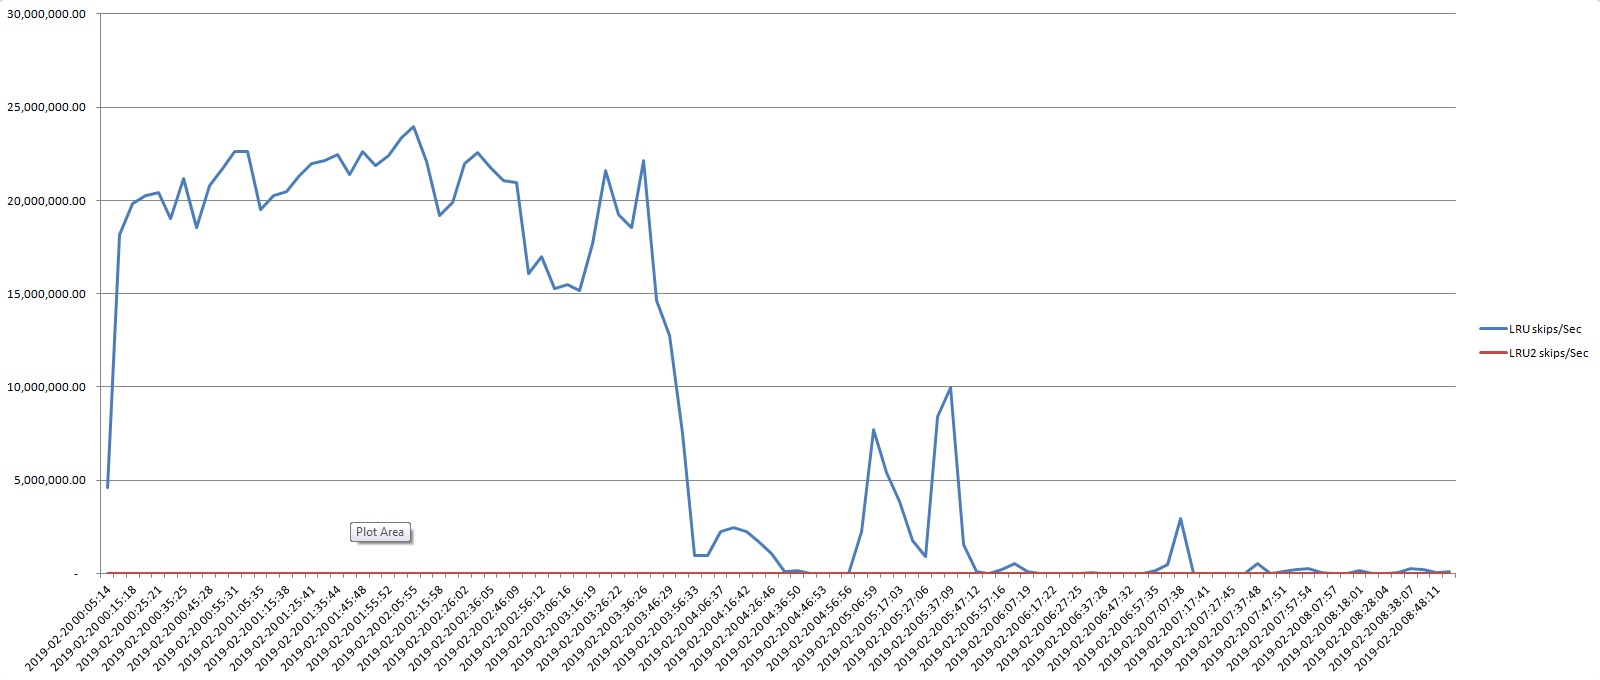
We have the huge LRU skips (_ActBuffer._Buffer-LRUSkips) - 20 millions per sec:
"The number of times a buffer on the LRU chain was skipped because it was locked or modified".
"promon/Status: Buffer Locks" reports only a few buffer locks per snapshot.
Why LRU skips are high? Private buffers?
i bet a counter has overflowed
20 millions "events" per sec => duration of the "event" is 50 nanoseconds - it's compatible with a duration of latch lock. LRU latch was indeed 100% busy (24 of 43 snapshots shown an owner of LRU latch) but we had only 10-12 thousands LRU locks per sec and 1500-3000 naps per sec. It looks like LRU latch can participate in two "events": locks and skips. Duration of each "event" can be estimated as the tens nanoseconds.
something is wrong with the lruskips counter value - lruskips ought not be much higher than logical reads + logical writes
> i bet a counter has overflowed
You known the answer! ;-)
02/20/19        Status: Buffer Cache
08:53:12
Total buffers:                     5000002
Hash table size:                   1452281
Used buffers:                      5042168
Empty buffers:                     4294925130
On lru chain:                      3999887
On lru2 chain:                     1000113
On apw queue:                      0
On ckp queue:                      0
Modified buffers:                  8450
Marked for ckp:                    0
Last checkpoint number:            143
LRU force skips:                   100
LRU2 force skips:                  100
Used buffers are larger than Total buffers by 42166 plus 2 (two blocks that are not on chains).
Empty buffers equals 4 billions minus 42166.
           Number of Database Buffers (-B): 4000000
Number of Alternate Database Buffers (-B2): 1000000
"On lru2 chain" is larger than -B2.
After db restart the fields in "Status: Buffer Cache" screen have returned to the reasonable values and the contention on the LRU latch disappeared.