
Hi ,
at a customer site we have the strange issue that a client-server query is much slower (factor 50) for a particular value.
I'm reading the first 100 records for a value. That value is the first field of the table's primary index.
To exclude buffering issues (db buffering is at 99%) I repeat the same query 3 times (loop value).
for value 5 this takes about 1.5 seconds for all other values it takes less than 50 milliseconds.
numeric decimal point is comma (,) in the tables below
value loop milliseconds count size size / time
1 1 42,00 100 60.285,00 1.435,36
1 2 38,00 100 60.285,00 1.586,45
1 3 39,00 100 60.285,00 1.545,77
3 1 42,00 100 73.777,00 1.756,60
3 2 39,00 100 73.777,00 1.891,72
3 3 39,00 100 73.777,00 1.891,72
4 1 37,00 100 56.757,00 1.533,97
4 2 37,00 100 56.757,00 1.533,97
4 3 28,00 100 56.757,00 2.027,04
5 1 1.436,00 100 89.057,00 62,02
5 2 1.408,00 100 89.057,00 63,25
5 3 1.394,00 100 89.057,00 63,89
6 1 31,00 100 69.513,00 2.242,35
6 2 32,00 100 69.513,00 2.172,28
6 3 34,00 100 69.513,00 2.044,50
9 1 143,00 100 80.258,00 561,24
9 2 132,00 100 80.258,00 608,02
9 3 129,00 100 80.258,00 622,16
If I change the index to another index that starts with value I don't have a big difference between the values
1 1 30,00 100 61.489,00 2.049,63
1 2 33,00 100 61.489,00 1.863,30
1 3 32,00 100 61.489,00 1.921,53
3 1 37,00 100 67.944,00 1.836,32
3 2 33,00 100 67.944,00 2.058,91
3 3 31,00 100 67.944,00 2.191,74
4 1 42,00 100 56.761,00 1.351,45
4 2 40,00 100 56.761,00 1.419,03
4 3 40,00 100 56.761,00 1.419,03
5 1 40,00 100 61.852,00 1.546,30
5 2 34,00 100 61.852,00 1.819,18
5 3 29,00 100 61.852,00 2.132,83
6 1 37,00 100 66.280,00 1.791,35
6 2 32,00 100 66.280,00 2.071,25
6 3 37,00 100 66.280,00 1.791,35
9 1 53,00 100 64.801,00 1.222,66
9 2 41,00 100 64.801,00 1.580,51
9 3 46,00 100 64.801,00 1.408,72
If I run my test procedure on a shared memory connection I don't see a big difference either.
/* test code */
define query qart for artikel.

define variable lstart as datetime no-undo.
define variable lcount as integer  no-undo.
define variable lsize as decimal  no-undo.
define variable ltime as decimal  no-undo.
define variable llimit as integer  no-undo init 100.

define variable ap-artikel as integer  no-undo init 1.
define variable lloop as integer  no-undo.
def var rawrecord as raw no-undo.


&if defined(winheightchars) = 0
&then
&global-define winheightchars 30
&endif

&if defined(winwidthchars) = 0
&then
&global-define winwidthchars 160
&endif

&if defined(winfont) = 0
&then
&global-define winfont 8
&endif

current-window = default-window.
assign
    default-window:row = 1
    default-window:column = 1
    default-window:width-chars = {&winwidthchars}
    default-window:height-chars = {&winheightchars}
    default-window:font = {&winfont}
    .
form with frame f-down down width-chars {&winwidthchars} font {&winfont}.

output to "clipboard".
view frame f-down.
aploop:
do ap-artikel = 1 to 9:
    do lloop = 1 to 3:
        lstart = now.
        lcount = 0.
        lsize = 0.
        open query qart for each artikel where artikel.ap-nr = ap-artikel use-index artikel1.
        get first qart .
        do while avail artikel and lcount < llimit:
            lcount = lcount + 1.
            raw-transfer artikel to rawrecord.
            lsize = lsize + length(rawrecord).
            get next QART.
        end.
        close query qart.
        IF lcount >= llimit
        THEN do:
             ltime = interval(now, lstart, "milliseconds").
             disp ap-artikel lloop  ltime label "milleseconds" lcount lsize (lsize / ltime)
                 with frame f-down.
             down with frame f-down.
        END.
        else next aploop.
    end.

end.
dbanalys info
                                                           -Record Size (B)-           ---Fragments--- Scatter
Table                                    Records    Size   Min   Max  Mean                Count Factor  Factor
PUB.ARTIKEL                              49210   25.0M   260  1028   532                56273    1.1     1.0

Table                      Index  Fields Levels         Blocks    Size  % Util  Factor
PUB.ARTIKEL
  ARTIKEL-ID                 578       1      2             71  542.4K    95.8     1.1
  ARTIKEL1                   577       2      2             99  456.5K    57.8     1.8
  ARTIKEL10                  579       3      2             99  456.9K    57.9     1.8
  ARTIKEL11                  580       3      2            100  452.2K    56.7     1.9
  ARTIKEL12                  581       2      2             72  328.1K    57.2     1.9
  ARTIKEL13                  582       3      2            101  452.3K    56.2     1.9
  ARTIKEL14                  583       5      2             25  110.8K    55.6     1.9
  ARTIKEL15                  584       5      2             15   66.4K    55.6     1.9
  ARTIKEL16                  585       3      2            100  451.4K    56.6     1.9
  ARTIKEL17                  586       2      2              9   41.5K    57.8     1.8
  ARTIKEL18                  587       2      2              7   33.1K    59.4     1.8
  ARTIKEL2                   588       3      2            346    1.5M    56.8     1.9
  ARTIKEL3                   589       3      2            326    1.4M    56.8     1.9
  ARTIKEL4                   590       3      2            135  654.2K    60.8     1.8
  ARTIKEL5                   591       3      2            128  505.2K    49.5     2.0
  ARTIKEL6                   592       3      2             99  474.7K    60.1     1.8
  ARTIKEL7                   593       3      2            101  457.1K    56.8     1.9
  ARTIKEL9                   594       2      2              7   33.1K    59.4     1.8
Carl, check SeekRatio of the indexes:
Hi George,
thanks for your reply, results of your code in the second table.
I found out that my idea that there is a difference between artikel1 and artikel2 index is wrong.
If I read all records instead of just the first 100, the times are similar for either index. There is a big difference between e.g. value 1 and value 5, both queries take about 6 seconds but the query for value 1 returns 10x more records
value       index         loop         time      #records      size     size/time
----------- -----------  ----------- ------------  ----------- ------------ ----------
         1           1           1         6.267      18.012    11.166.397    1.781,78
         1           1           2         6.058      18.012    11.166.397    1.843,25
         1           2           1         6.014      18.012    11.166.397    1.856,73
         1           2           2         6.296      18.012    11.166.397    1.773,57
         2           1           1             1           2         1.175    1.175,00
         2           1           2             2           2         1.175      587,50
         2           2           1             1           2         1.175    1.175,00
         2           2           2             2           2         1.175      587,50
         3           1           1         6.802      18.713    13.811.638    2.030,53
         3           1           2         6.866      18.713    13.811.638    2.011,60
         3           2           1         7.004      18.713    13.811.638    1.971,96
         3           2           2         6.898      18.713    13.811.638    2.002,27
         4           1           1         2.732       7.468     4.170.267    1.526,45
         4           1           2         2.310       7.468     4.170.267    1.805,31
         4           2           1         2.175       7.468     4.170.267    1.917,36
         4           2           2         2.451       7.468     4.170.267    1.701,46
         5           1           1         5.951       1.821     1.269.847      213,38
         5           1           2         5.917       1.821     1.269.847      214,61
         5           2           1         5.928       1.821     1.269.847      214,21
         5           2           2         5.995       1.821     1.269.847      211,82
         6           1           1           757       2.389     1.619.747    2.139,69
         6           1           2           735       2.389     1.619.747    2.203,74
         6           2           1           884       2.389     1.619.747    1.832,29
         6           2           2           930       2.389     1.619.747    1.741,66
         7           1           1             1           0             0        0,00
         7           1           2             1           0             0        0,00
         7           2           1             1           0             0        0,00
         7           2           2             1           0             0        0,00
         8           1           1             2           0             0        0,00
         8           1           2             1           0             0        0,00
         8           2           1             1           0             0        0,00
         8           2           2             1           0             0        0,00
         9           1           1           480         805       520.384    1.084,13
         9           1           2           394         805       520.384    1.320,77
         9           2           1           417         805       520.384    1.247,92
         9           2           2           386         805       520.384    1.348,15
────────────────────────────Seek Ratio─────────────────────────────
File-Name                 Index-Name                         Ratio
───────────────────────── ───────────────────────── ──────────────
ARTIKEL                   ARTIKEL-ID                      1.680,92
ARTIKEL                   ARTIKEL1                          152,63
ARTIKEL                   ARTIKEL10                         152,63
ARTIKEL                   ARTIKEL11                         167,31
ARTIKEL                   ARTIKEL12                           1,00
ARTIKEL                   ARTIKEL13                         165,54
ARTIKEL                   ARTIKEL14                         106,77
ARTIKEL                   ARTIKEL15                           1,00
ARTIKEL                   ARTIKEL16                         167,31
ARTIKEL                   ARTIKEL17                           1,00
ARTIKEL                   ARTIKEL18                           1,00
ARTIKEL                   ARTIKEL2                          350,27
ARTIKEL                   ARTIKEL3                          329,21
ARTIKEL                   ARTIKEL4                          158,17
ARTIKEL                   ARTIKEL5                          150,79
ARTIKEL                   ARTIKEL6                          152,63
ARTIKEL                   ARTIKEL7                          152,63
ARTIKEL                   ARTIKEL9                            1,00
> If I read all records instead of just the first 100, the times are similar for either index.
By default SeekRatio.p reads 10,000 first records and it's still only 25% of the records in your tables. The "Artikel-Id" index shown a very bad number. Could it be a some "globally unique" ID, in other words some random value that is not correlated with the order of their creation (and with their location inside database)?
> To exclude buffering issues (db buffering is at 99%) I repeat the same query 3 times
I missed this part. Seek ratio has a meaning only when records are retrieved from disks.
Hi George,
> Could it be a some "globally unique" ID, in other words some random value that is not correlated with the order of their creation (and with their location inside database)?
No, artikel-id is an unique index on a decimal field . The integer part of it the field is from a progress sequence, the decimal part is a sitenumber.
I'm not using that index in my tests, using artikel1 and artikel2, but it seems both are equally slow if I read all records.
I should have mentioned this started to occur (or be noticed) after a switch to from oe102b to oe116 using proutil -C conv1011.
The database is type II utf-8
Carl, can you try to use the TestStat.i code to gather the statistics during query execution?
I had to tweak the code a bit for client server (change the path to db log file) as the issue is only on client-server.
I ran it twice, first for value 5 , then for value 1.
Resrc Id Type Name Locks Waits Repeats Duration Program n B lruskips L lkhash Notes Progress Host Date
0 --- --- 0 0 1000000 ,14 c:\tmp\p45900_Untitled2.ped 113 1000002 0 150016 ? 11.6 FR-TS3 2016-07-12T12:05:28.881+02:00
0 --- --- 0 0 1000000 ,143 c:\tmp\p45900_Untitled2.ped 113 1000002 0 150016 25621 11.6 FR-TS3 2016-07-12T12:08:34.789+02:00
0 --- --- 0 0 1000000 ,148 c:\tmp\p45900_Untitled2.ped 113 1000002 0 150016 25621 11.6 FR-TS3 2016-07-12T12:11:17.357+02:00
This is on a test database copied from the production db.
I did an index rebuild for all index of that table. => no effect
I created a new table using the same schema and data => same issue on the new table
> I had to tweak the code a bit for client server (change the path to db log file) as the issue is only on client-server.
It's again my fault. Today is not my day. ;-( BTW, TestStat.i uses db log file only to get the current value of the -lkhash parameter.
Change "RUN ReportStat(vRepeats)' to 'RUN ReportStat(1)' because you do not repeat a test between GetStat(1) and GetStat(2). TestStat.i sets vRepeats to 1000000 just for my tests that check the durations of latch locks. ;-)
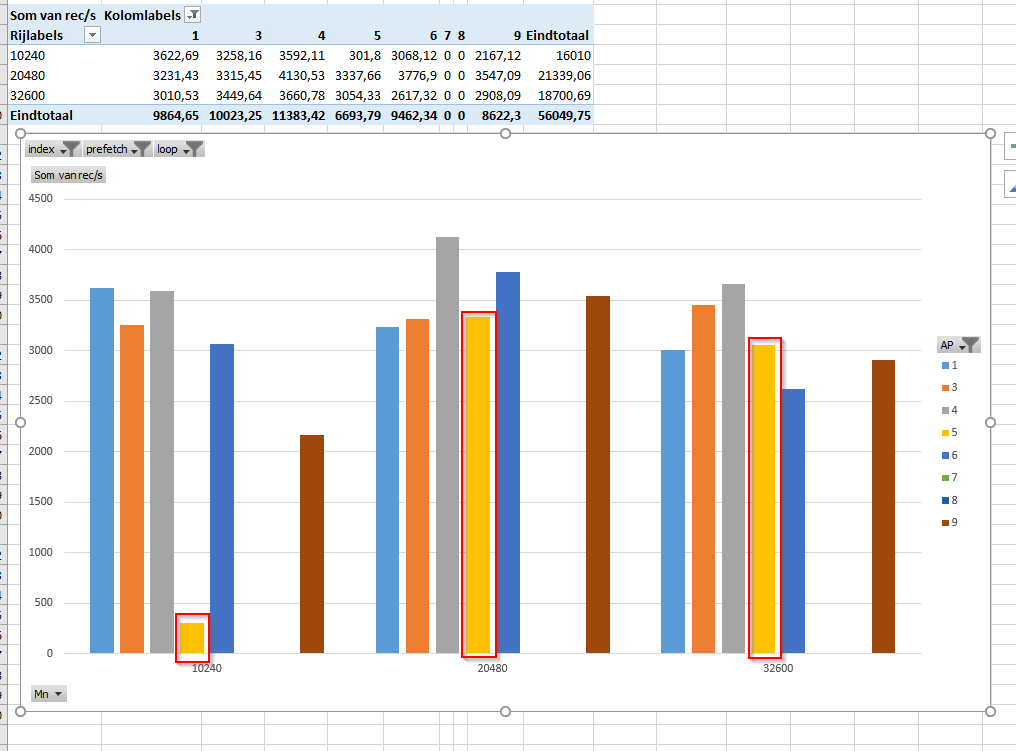
I haven't yet found what is special about AP = 5 but I have found that changing -Mm (more or less the only network parameter performance parameter I know) has a dramatic effect.
-Mm was at 10240
I changed it to 20480 and now my test has similar results for all records.
Found this community.progress.com/.../22282
Speaking of -Mm.. where does one specify -Mm for the database using the Progress Explorer?
My presentation "Benchmarking Network Data Transfers" will be available soon to download from http://pugchallenge.org and I will be giving an updated version in Nordwijk in October at EMEA PUG Challenge.
Jeff - it's not in the main configuration screen. It's where you configure the -S/-minport/-maxport/-Mi/-Ma/-Mpb for the remote brokers.
Carl, is it possible that the record for 5 is much larger than the other records ... containing a blob or large character value, for example?
Ah, found it. Thx.
Thanks for all help and suggestions
This graph shows the number of records / second for different values using -Mm values 10240, 20480 and 32600.
I don't yet know why the impact for value 5 is so big.
I'll also do a test with OpenEdge 10.2B because we had no (known) issues in that version. I'll keep you updated
I just got a new lesson in never assume, always check.
The database log file showed was running with the default -Mm 1024 initially.
I'll rerun my tests
are the records for value 5 appreciably different size than others?
Dbanalys says: Min 260, Max 1028, Mean 532.
With -Mm 1024 the most network packages would contain only one record.
@gus ,
The average record size (700 bytes) is similar but I suspect an uneven distribution .
I'll do some further tests but I'm out-of-office tomorrow.
The problem is indirectly related to the OE11.6 migration.
We have been using -Mm 10240 for many years now, the client had -Mm 10240 in it's configuration . In 11.6 client and server no longer need to have matching -Mm and it went unnoticed that the server was running with the default of 1024.
> The average record size (700 bytes) is similar but I suspect an uneven distribution .
Then NO-PREFETCH option or share/exclusive locks would make a record size distribution irrelavant for the queries and all queries should be /equally/ slow.
numerous experiments by different people have shown that you should use much larger -Mm, like 16384.
that makes a large improvement.