
I hope this isn't against the forum rules but I wanted to share a blog post I made about getting the promon Activity metrics into a Zabbix graph (This is a little specific to our ERP, Epicor, but applies to any progress DB:
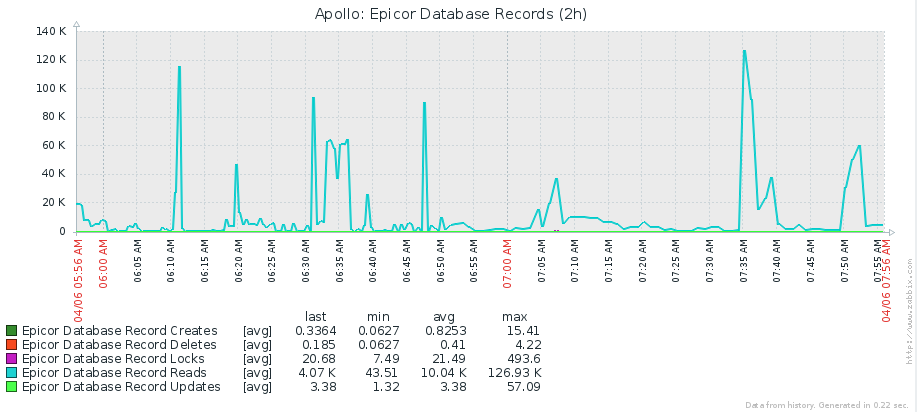
Basically it's a python script that automatically scrapes data from promon and sends it to our Network Monitor, Zabbix.
I've never been able to find a (free, windows) performance monitor for Progress, so I finally decided to make my own.
edit: I forgot to add the link:
https://epicoradmin.wordpress.com/2016/04/06/monitoring-your-openedge-progress-database-with-zabbix/
ProTop is a free performance monitor for Progress and has this ability and much, much more.
Contact me offline for more details.
Thanks Jeff for this post, very informative. I've been going through your python script and I would like to know what parameters you are using in the pickle.dat file? if you could send me an example that would be great.
Gareth Vincent